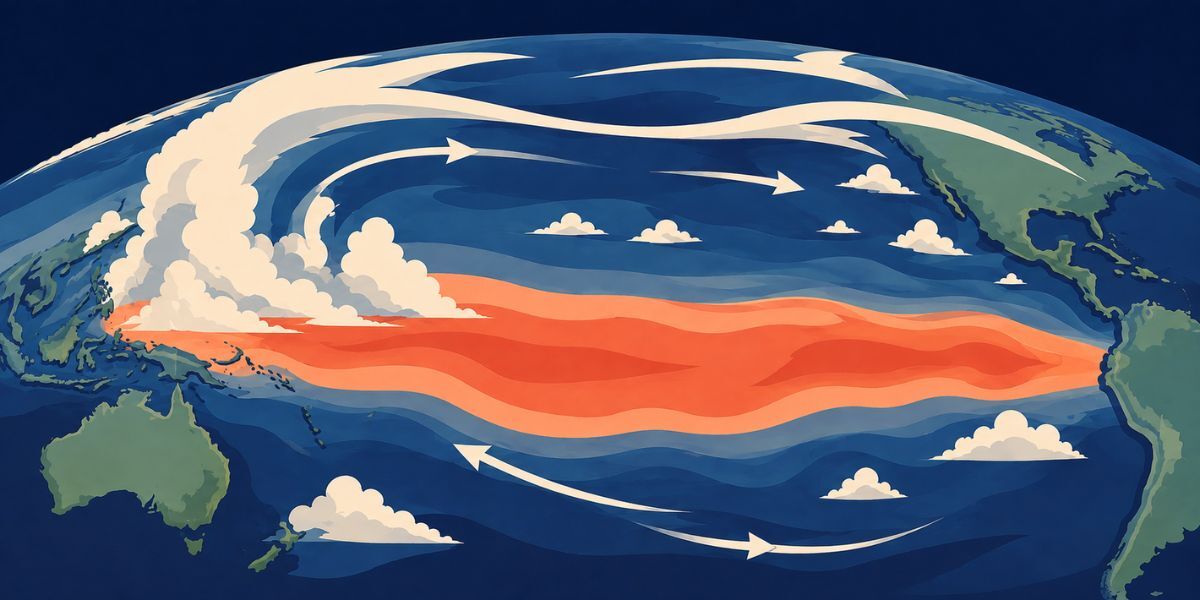
Every few years, news reports about El Niño appear, along with striking details about its effects on storm systems, society, and nature. In recent weeks and months, news outlets and social media accounts across the globe have reported that a potentially record-breaking El Niño event is underway in the latter half of 2026. While people know that El Niño is “something that happens in the Pacific Ocean,” many lack details on what that “something” is.
El Niño is a naturally occurring phenomenon that broadly impacts regions worldwide. Strong El Niño events also increase climate-related risks, adding another reason to understand the potential impacts. In this explainer, we unpack what El Niño is, how El Niño influences risks worldwide, and what can be reasonably expected in the coming months.
What Is El Niño?
Alexa Wood
Simply stated, El Niño describes a set of conditions in which a defined region of the Pacific Ocean is warmer than average.
As the largest body of water on Earth, the Pacific Ocean has the capacity to retain a massive amount of heat. The ocean is constantly exchanging heat with the atmosphere. During El Niño, this exchange contributes to warmer global atmospheric temperatures and alters typical weather patterns.
El Niño events occur when winds that typically blow westward from South America toward Asia weaken or reverse, which allows a region of warmer-than-average water to develop in the Central and Eastern Pacific. El Niño is often discussed in conjunction with the Southern Oscillation, which describes the wind patterns that are associated with the El Niño-Southern Oscillation (ENSO) system. The opposite pattern is called La Niña, which occurs when the typical wind patterns intensify, leading to colder water in the Central and Eastern Pacific.
El Niño and La Niña alternate, with each occurring every two to seven years, with a neutral phase in between. Typically, El Niño events span two calendar years and reach peak intensity during winter in the Northern Hemisphere. Though scientists understand the mechanism of the ENSO system, the conditions that trigger El Niño and La Niña events are still being actively researched.
How is El Niño Measured?
In many jurisdictions, El Niño conditions are determined by measuring the average sea surface temperature (SST) across a portion of the Pacific between 5° north and 5° south of the Equator, and 120°W-170°W, known as the Niño 3.4 region (see Figure 1). The United States’ National Weather Service (NWS) Climate Prediction Center (CPC) compares how much the SST of the Niño 3.4 region differs from the global tropical average SST. When the Niño 3.4 SST remains at least 0.5°C warmer than the average global tropical SST over at least five overlapping 3-month periods, the CPC declares a full-fledged El Niño event is occurring.1
Other regions — including India, Australia, Japan, Peru, Europe, and the U.K. — also monitor El Niño development. Their operational definitions differ slightly because agencies use different monitoring regions, averaging periods, persistence requirements, and alert systems to support regional forecasting and preparedness.
Figure 1: Location of Major El Niño Monitoring Region – Niño 3.4
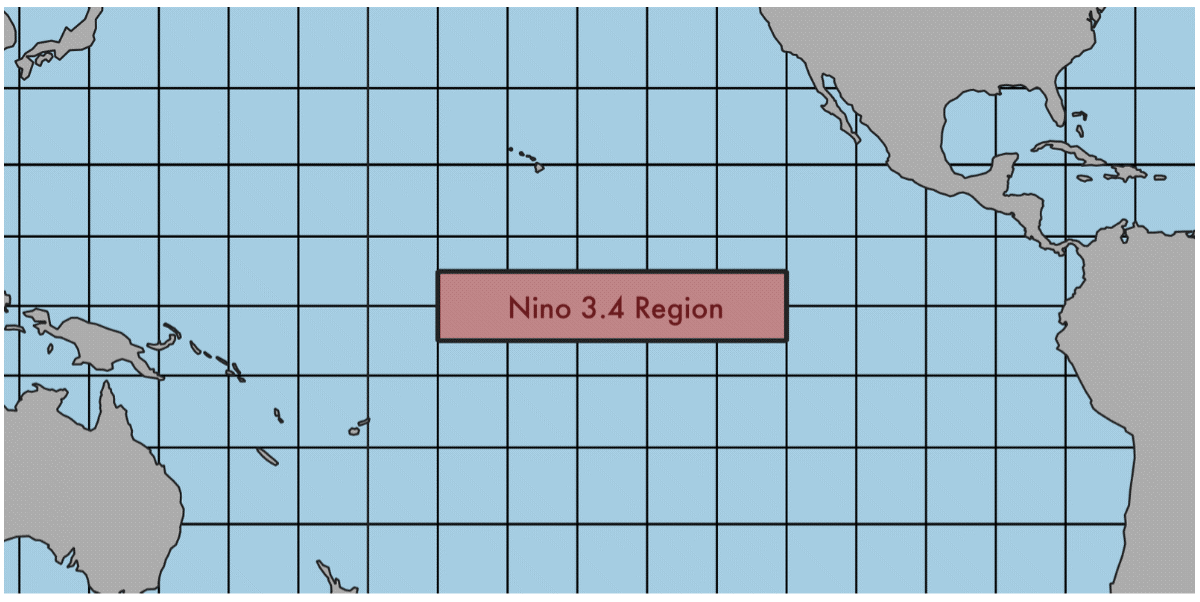
Source: Alexa Wood, via QGIS using Natural Earth public-domain geographic data. Niño 3.4 boundaries are based on definitions from the NOAA Climate Prediction Center.
The Current El Niño Is Expected to Be Very Strong
Most recently, El Niño occurred from 2023-2024 and was the fifth strongest since official measurements began in 1950. That El Niño event contributed to Earth recording its warmest global average surface temperature since the dawn of the Industrial Era. Globally, the average surface temperature in 2024 was more than 1.5°C warmer than average temperatures in the mid-1800s. Though the 2024 record was a temporary rise above an important global temperature threshold, it demonstrated how natural processes exacerbate human-induced warming.
In its monthly update, the CPC issued an El Niño Advisory, indicating that the average sea surface temperature in the Niño 3.4 region surpassed the 0.5°C threshold described above. Though the U.S. was the first to declare the onset of El Niño, the global consensus suggests that El Niño conditions will strengthen in the coming months. As of the September 2026 update, U.S.-based forecasts suggest a “Very Strong El Niño” has an over 95% chance of occurring, meaning that the Niño 3.4 region of the Pacific Ocean is very likely to equal or surpass the global tropical SST by 2°C when El Niño reaches its peak in late 2026. The CPC states there is a 75% chance that by year’s end the current El Niño will be stronger than all other El Niño events measured since 1950.
The European Centre for Medium-Range Weather Forecasts (ECMWF), another major forecasting body, has published model outputs that suggest the Niño 3.4 region could exceed the global tropical average by 2.5-3.5°C at peak intensity. If the ECMWF El Niño model guidance is correct, it would be the warmest El Niño ever recorded.
Predicting the average temperature over a large swath of the Pacific Ocean is enormously challenging, and as of this writing, the future peak value of this El Niño event is unknown. However, it is worth noting that U.S.- and EU-based forecast updates have consistently predicted an intense El Niño event for the past several months. Regardless of strength, El Niño has a wide set of impacts that vary across the globe.
Global El Niño Impacts
Though the El Niño phenomenon itself is contained in the Pacific Ocean, its impacts are worldwide as can be seen in Figure 2.
Before looking at typical impacts, it is important to acknowledge that other large-scale atmospheric patterns also influence day-to-day weather. While El Niño increases the likelihood that the patterns described below will occur, it is not possible to precisely predict specific impacts.
When El Niño conditions are present, the following impacts are more likely to occur:
- Hurricane activity in the Atlantic Ocean is suppressed, which provides a modest benefit to the region.
- During winter in North America, the northern U.S. and Canada often experience warmer temperatures, whereas the southern U.S. areas adjacent to the Gulf of Mexico experience increased precipitation.
- South America generally experiences above average temperatures across the continent, due to its proximity to the increased warmth in the Pacific Ocean.
- Additionally, in South America, flood risks are higher along the Pacific coast, whereas drought conditions are more likely to develop near the Atlantic Ocean and in the Amazon River basin.
- Arid regions of Western and Southern Africa are more likely to experience even drier conditions.
- Precipitation in Eastern Africa often increases, leading to enhanced flooding.
- The wet monsoon in India weakens, leading to decreased rain nationwide.
- Tropical regions of Asia may expect drought conditions to develop alongside increased heatwaves.
- Much of Australia experiences increased heat and drought across the continent.
- Warmer waters and favorable winds in the Pacific Ocean support increased tropical cyclone activity across much of the basin.
- Small Pacific island nations experience wide-ranging effects that are influenced by proximity to the El Niño epicenter.
Figure 2: Common El Niño Impacts in Summer and Winter Across the Globe
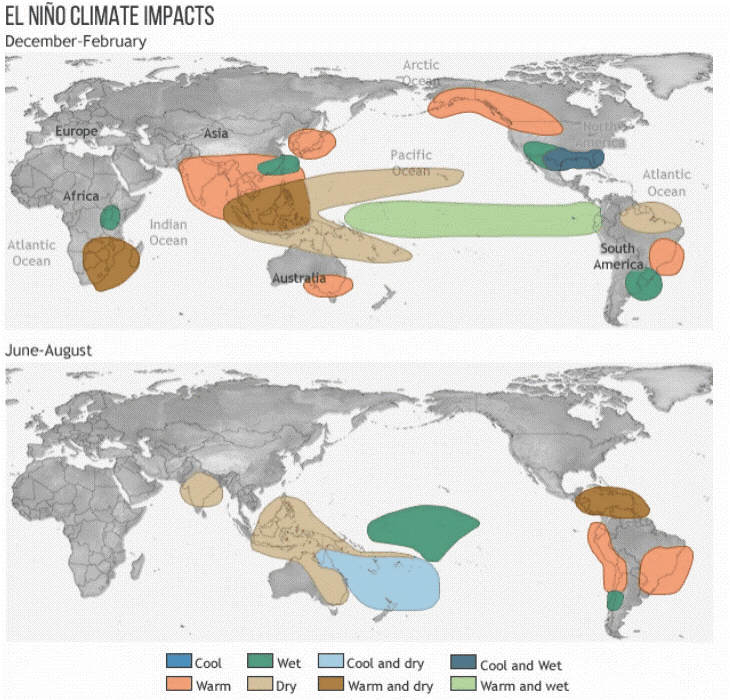
Source: Global impacts of El Niño and La Niña, from NOAA Climate.gov
Uncertainty Exists Around Magnitude and Distribution of Impacts
The 2023–2024 El Niño was linked to record global warmth, which helped create conditions that made extreme heat in parts of Asia and North America, and flooding in parts of Africa, more likely. It is not accurate to say that El Niño “caused” a specific weather event. Rather, El Niño increased the likelihood that those extreme weather events would occur.
Another way to conceptualize this is that El Niño worsens climate-related risks worldwide by adding another layer of risk to those driven by climate change. If past trends are repeated, Earth may once again experience much warmer-than-normal average surface temperatures in 2027, which in turn can exacerbate risks associated with extreme weather.
Like the challenges of forecasting the peak strength of the current El Niño, we cannot yet know how much warming the Earth will experience in 2027. However, it is worth noting that since the 1990s, there has been a global temperature spike in the year following the onset of strong El Niño events.
Finally, though El Niño temporarily enhances warming attributed to climate change, there is no consensus on the degree to which climate change influences ENSO cycles.
Figure 3: El Niño and La Niña Years vs. Global Surface Temperature, 1950-2025
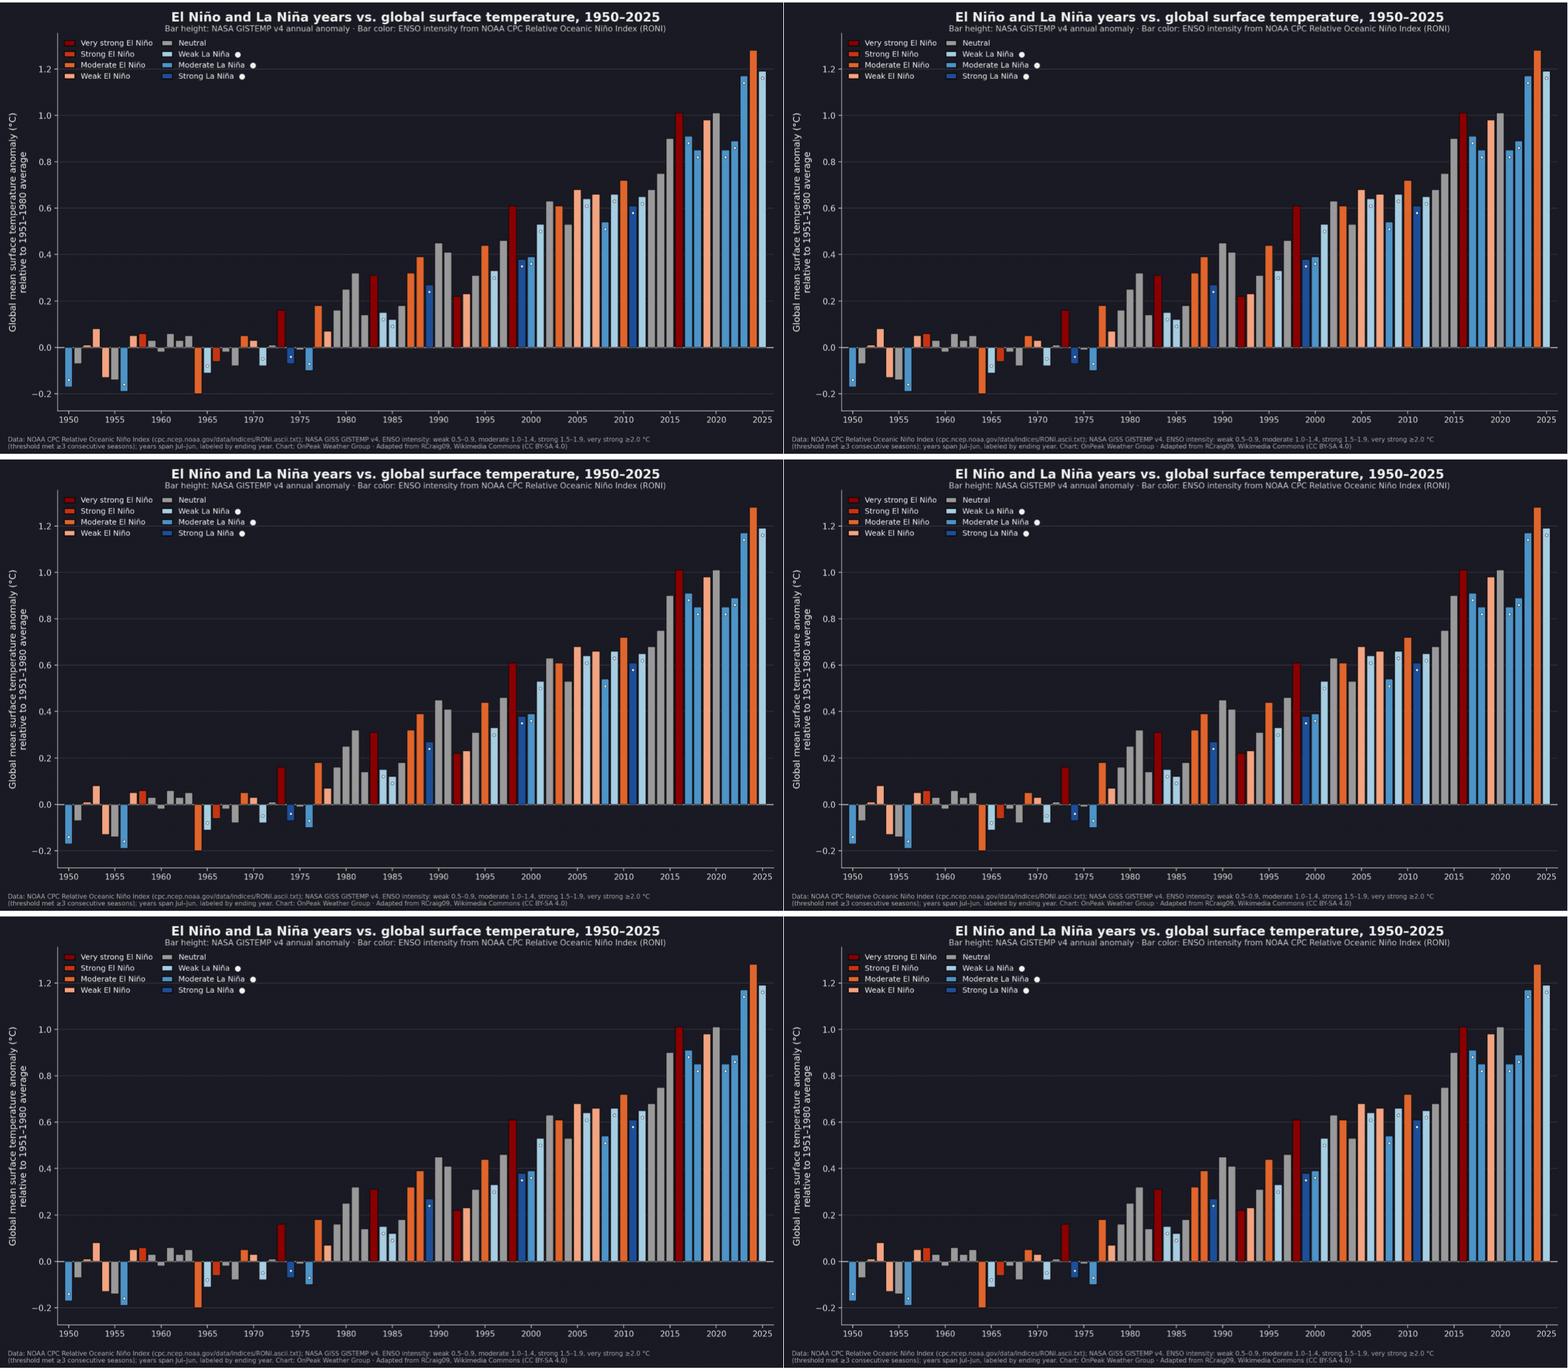
Source: OnPeak Weather Group Unpublished Data
Note: The figure uses a 1951–1980 reference period, whereas the 1.5°C threshold discussed in the text is measured relative to the 1850–1900 pre-industrial average. The anomalies measured against both reference periods differ, which explains why the values in the figure are lower than anomalies measured against the pre-industrial average.
Parting Thoughts
As the specific impacts of the current El Niño event remain in the future, there is still time to prepare for the enhanced risks associated with this and other climate events. To receive regular updates on El Niño conditions, monitor periodic updates issued by the relevant government-supported weather and climate offices in your country or region. Additionally, the World Meteorological Organization (WMO) provides information and resources relevant to audiences worldwide.
To further develop knowledge and skills needed to address the weather and climate risks posed by El Niño events and beyond, GARP offers the Sustainability and Climate Risk (SCR®) Program twice annually, in April and October. The SCR Program provides key knowledge to help risk professionals understand climate risk, prepare for uncertainty, and develop tools to proactively build climate resilience.
__________
1Comparing the Niño 3.4 SST with the average global tropical SST is a recent development in monitoring El Niño conditions due to climate change influencing average SSTs. Since climate change has warmed the ocean worldwide, the fixed baseline formerly used made recent El Niño events look artificially stronger (and every La Niña look weaker) because background warming artificially influenced the actual ENSO signal. The U.S. started using this relative metric in February 2026, while the European Centre for Medium-Range Weather Forecasts (ECMWF) adopted it in June 2026.
Sources to Monitor Current El Niño Conditions:
- World Meteorological Organization (WMO)
- NOAA Climate Prediction Center (US)
- European Centre for Medium-Range Weather Forecasts (ECMWF)
- Australian Bureau of Meteorology (BoM)
- Japan Meteorological Agency (JMA)
- India Meteorological Department (IMD)
- Peru - ENFEN
- UK Met Office
_________
Dr. Alexa Wood, Assistant Vice President, Sustainability and Climate Risk (SCR), joined GARP in 2022. She has spent much of her career in academia as a researcher specializing in climate risk perceptions and has also worked in university administration roles.
Acknowledgments: The author thanks Dr. Tyler McCandless for providing technical review and for generating the ENSO/global temperature anomaly figure.
Note: This was article was updated on September 10, based on the U.S. CPC El Niño/Southern Oscillation Diagnostic Discussion.
Topics: Physical Risk