
Methane is responsible for roughly one-third of the increase in global temperatures since pre-industrial times, making it the second-largest contributor to anthropogenic warming after carbon dioxide. Because methane is a highly potent greenhouse gas, with a warming potential approximately 80 times that of carbon dioxide over a 20-year period, reducing methane emissions is widely regarded as one of the most effective opportunities to slow near-term warming. Much of this opportunity lies within the energy sector, which accounts for around 40% of global methane emissions from human activity.
Ivana Petrich
However, more than a decade after the Paris Agreement, methane emissions from some sectors continue to rise despite an expanding array of mitigation targets — including the Global Methane Pledge — and reporting frameworks designed to improve emissions transparency, such as the Oil and Gas Methane Partnership (OGMP 2.0).
In its 2026 Methane Tracker, the International Energy Agency (IEA) concludes that global energy-related emissions remain steadily high, even though an estimated 30% of emissions from fossil fuel operations can be reduced at no cost.
Beyond the challenge of reducing emissions, a persistent gap remains between what is reported and what is measured. One study found that satellite-derived methane estimates exceed United Nations Framework Convention on Climate Change (UNFCCC)-reported emissions by 15%. For investment professionals relying on company-reported sustainability data to assess transition risk and progress toward targets, it raises an important question: to what extent do reported emissions reflect actual operating conditions, and what measurement processes underpin those disclosures?
Against this backdrop, satellite and aircraft sensors are increasingly being relied upon to independently assess methane emissions across sectors and geographies and improve data measurement quality. These observations will play a growing role in reconciling top-down measurements with bottom-up inventories, strengthening the accuracy and credibility of both voluntary and regulatory reporting frameworks. Independent monitoring also introduces an additional layer of accountability, enabling companies to identify and respond to events more quickly and supporting faster emissions reductions.
Different Satellites Serve Different Purposes
Today, multiple public, commercial, and not-for-profit satellite missions contribute to methane monitoring, serving complementary roles ranging from global mapping by the European Space Agency’s Sentinel 5P TROPOMI instrument to regional emissions mapping by MethaneSAT and facility-level monitoring by GHGSat , as shown in Figure 1. Other missions, including Carbon Mapper and NASA’s Earth Surface Mineral Dust Source Investigation (EMIT), also enable detection of large methane emission sources, while land-imaging satellites such as Landsat and Sentinel-2 provide valuable operational context through high-resolution imagery.
These missions and systems provide complementary capabilities because they differ in spatial resolution, revisit frequency, geographic coverage, and detection sensitivity, allowing analysts to match the right dataset to the question being asked. For example, a global asset manager screening methane exposure across hundreds of companies may rely on TROPOMI to identify regional emission hotspots, while a lender conducting due diligence on a specific oil and gas operator may use GHGSat to assess emissions performance at the facility level. In addition, Landsat and Sentinel-2 imagery can identify facility expansions, new well pads, flaring infrastructure, or other changes to help explain observed emissions.
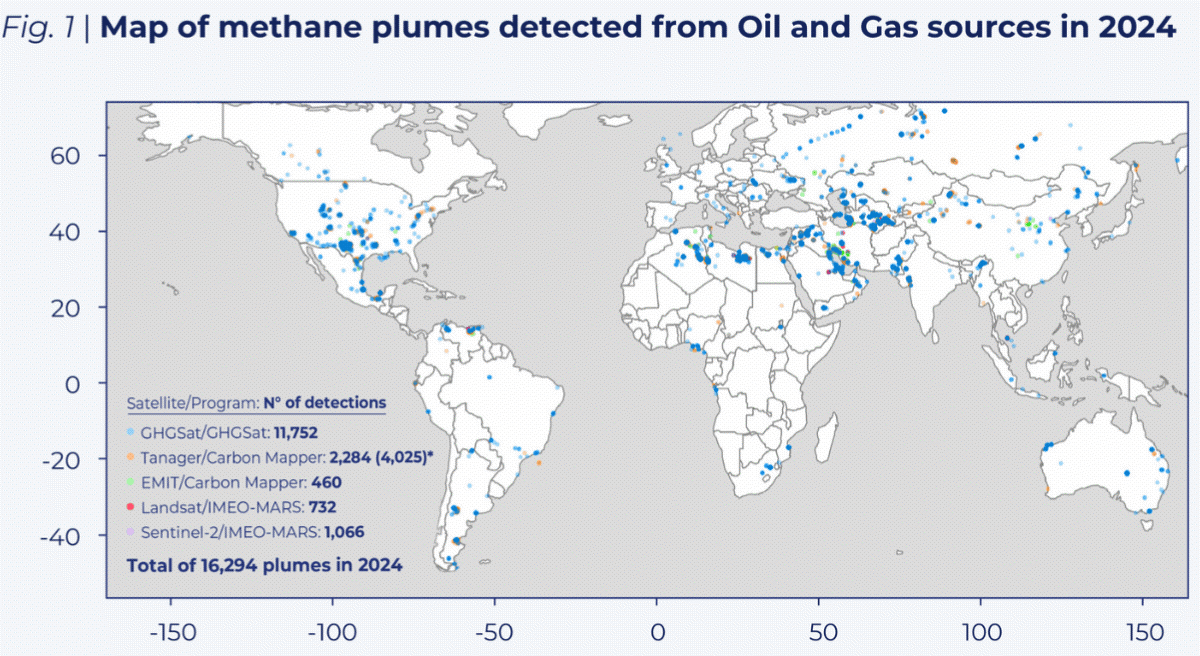
Note | *Tanager/Carbon Mapper data covers Sept. 19, 2024, to Aug. 31, 2025. The value in parentheses is an estimate of detections for a full calendar year.
Source: Jervis et al. (2026) Joint Estimation of the Global Facility-Scale Oil–Gas Methane Emission Rate Distribution and Survey-Mode Detection Probabilities from Multiple Satellite Systems
What Satellite Data Can Reveal by Sector
In 2025, GHGSat’s constellation of 14 satellites (expanded to 17 satellites as of July 2026) detected an estimated 25 million metric tonnes (Mt) of methane from the oil and gas, mining, and waste sectors, observing more than 2.9 million facilities across 127 countries (see Figure 2). Half of these emissions originated from the oil and gas sector, where estimated methane emissions were equivalent to more than 17 billion cubic meters (BCM) of natural gas, with a theoretical market value of approximately USD 2.3 billion at the 2025 average Henry Hub price, the primary benchmark for North American natural gas pricing.
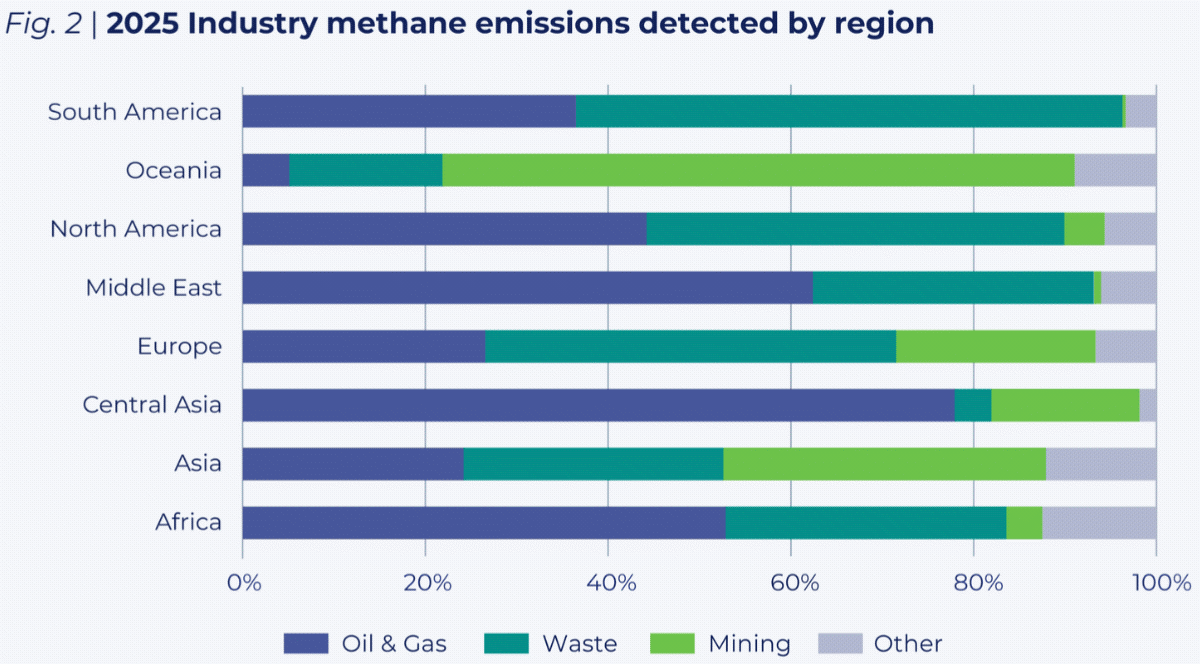
Source: GHGSat
Estimated oil and gas emissions were also highly concentrated geographically, with the top 10 countries accounting for more than 75% of the total, as can be seen in Figure 3.
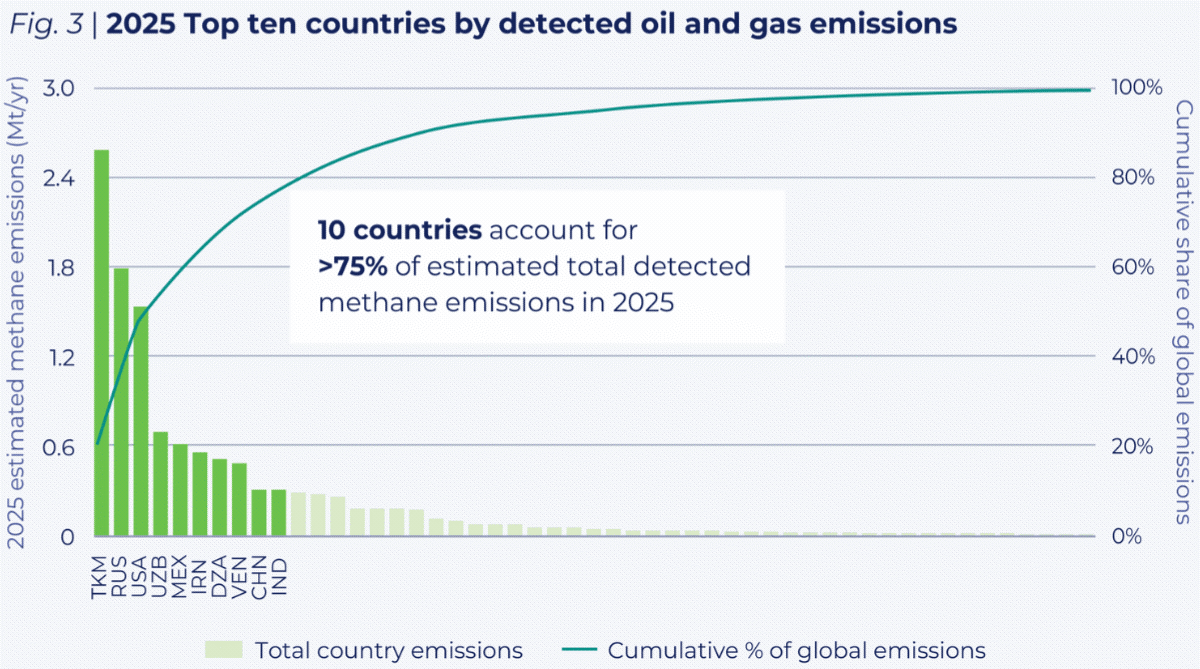
Note: Data is coverage dependent with a higher number of detections in targeted areas.
Source: GHGSat, Energy Institute
Although methane emissions generally increase with higher oil and gas production, production volumes alone do not explain the wide variation observed across countries. In 2025, the U.S. produced 28 times more oil and gas than Turkmenistan but generated only 60% of Turkmenistan’s total detected methane emissions, based on GHGSat estimates (see Figure 4). The comparison suggests that differences in methane management, infrastructure, and operational practices may have a greater influence on emissions than production volumes alone.
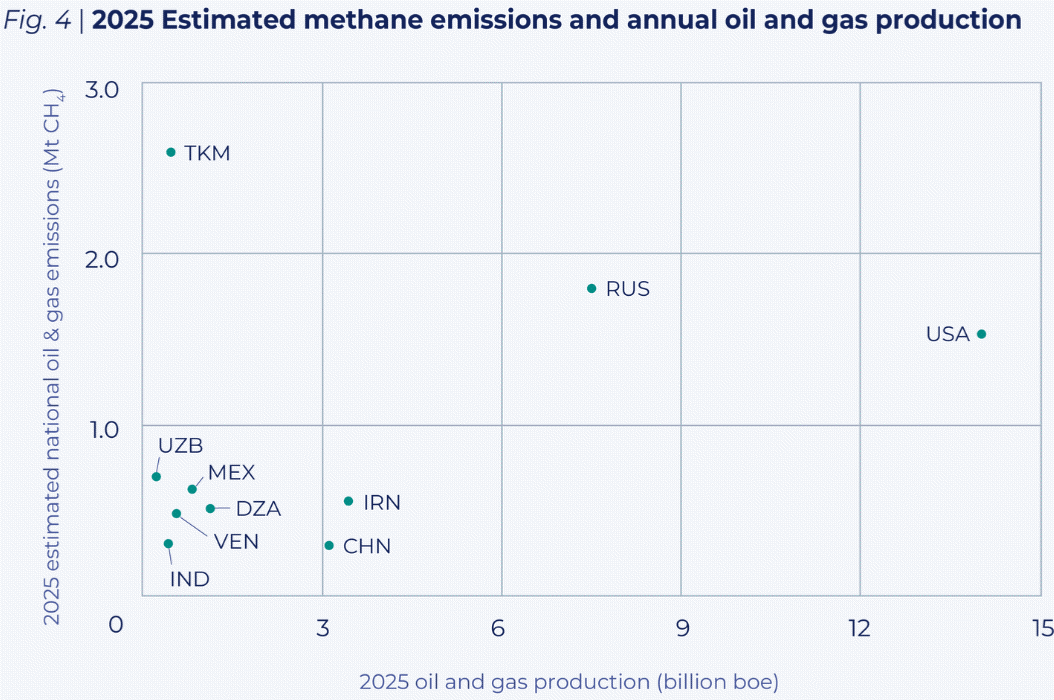
Source: GHGSat, Energy Institute
What Satellite Data Can Reveal at a Facility Level
Satellites play an important role in detecting super-emitter events, commonly defined as methane releases exceeding 100 kg/hr. While research suggests that smaller emission sources collectively account for a significant share of total methane emissions, satellite observations demonstrate that a few facilities can contribute disproportionately to an operator’s overall emission profile.
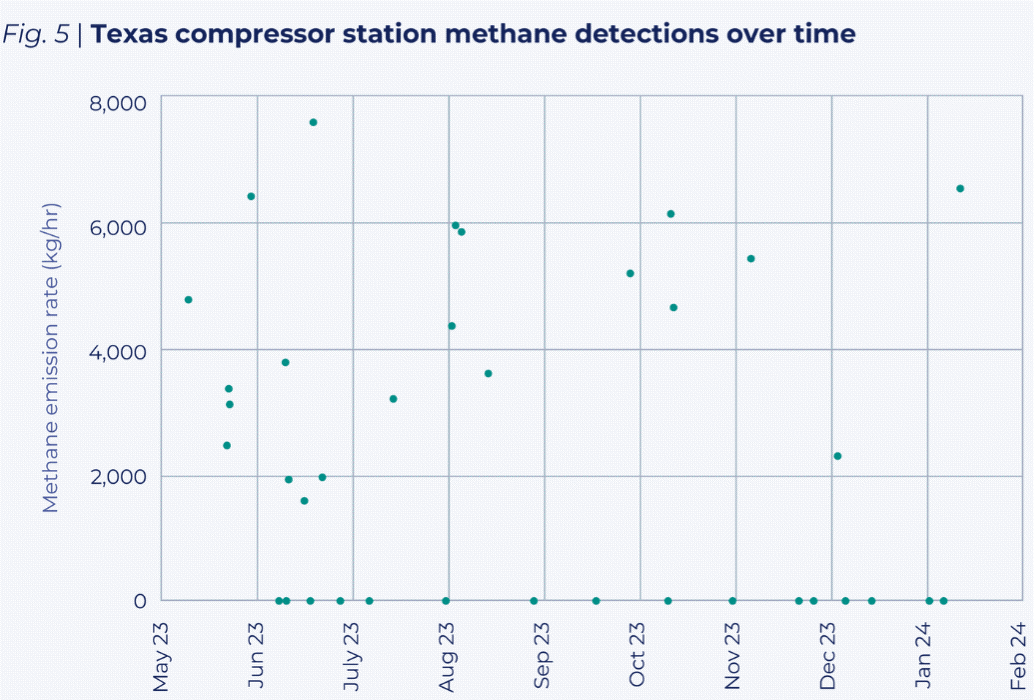
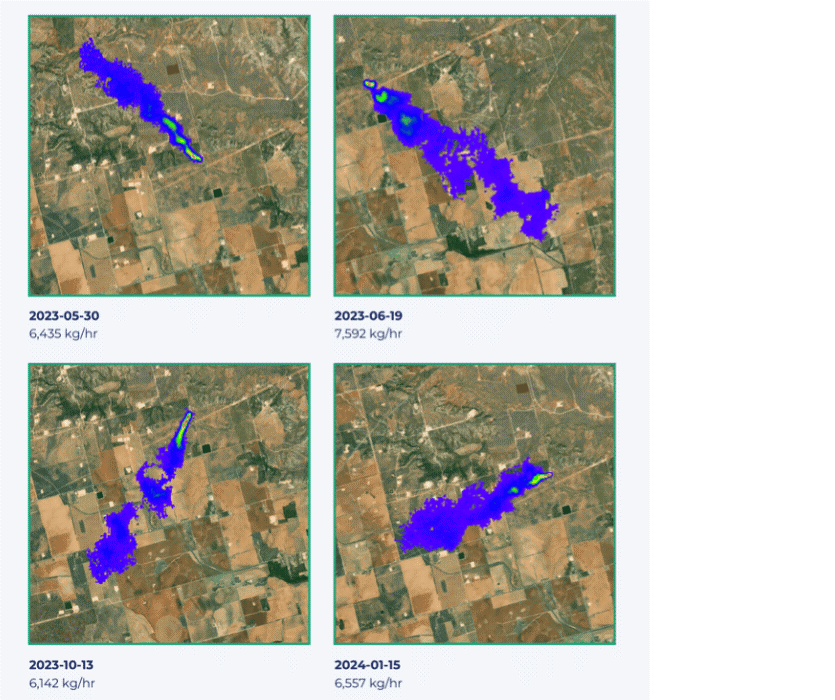
For example, GHGSat satellites detected persistently high-volume methane emissions from a Texas compressor station in 2023 owned by a publicly traded midstream company, as shown in Figure 5. Subsequent analysis estimated that emissions from this single facility accounted for approximately 25% of the basin-wide methane emissions the operator reported to the U.S. Environmental Protection Agency (EPA) that year, despite the company operating hundreds of assets across the basin. The methane losses were estimated at approximately USD 834,000 in lost product annually, highlighting both the financial impact of methane waste and the extent to which a small number of facilities can account for a disproportionately large share of total emissions.
Source: GHGSat
Uzbekistan Blowout Case Study
On September 1, 2024, drilling operations at a site in Uzbekistan’s 25 Years of Independence gas field experienced a loss of well control, resulting in a prolonged release of natural gas. Multiple attempts to cap the well were unsuccessful, and on September 17, 2024, another accident during response operations resulted in four fatalities and 11 injuries.
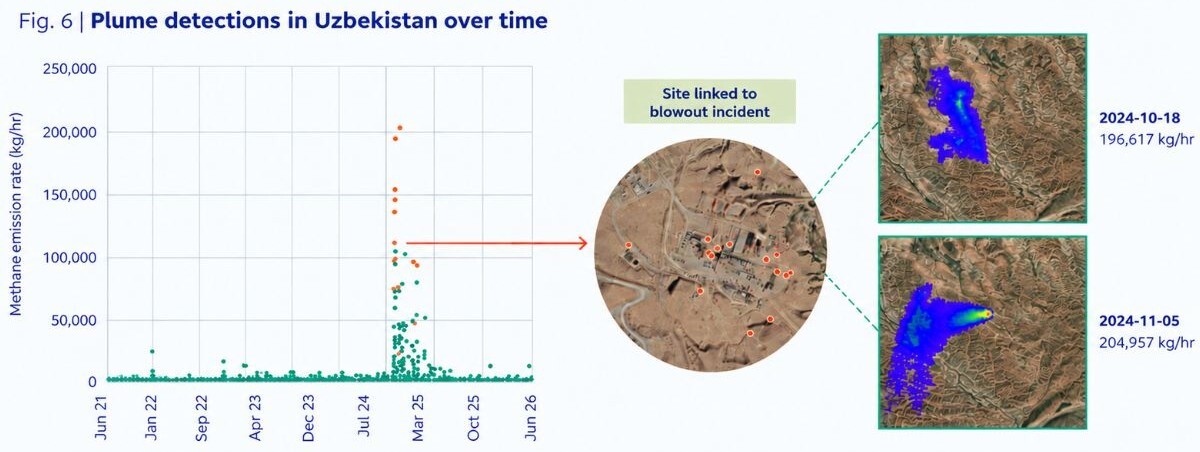
Following the incident, GHGSat deployed its satellites to monitor the affected area and quantify methane emissions from the damaged infrastructure. Between October 2024 and February 2025, at least 20 plumes were detected from the affected facility, including seven with estimated emission rates greater than 100,000 kg/hr within the first month of observations (Figure 6). To put this into context, while the length of the emissions isn’t known, if each of the detected plumes had persisted for even just one hour they would be very severe emissions — surpassing the estimated total from all U.S. plumes detected in 2025.
Source: GHGSat
Why Measurement Matters in Transition Finance
Today’s transition finance ecosystem is built largely on corporate emissions disclosures, many of which report emissions inventories based on engineering estimates and emission factors rather than direct measurements. These disclosures underpin ESG ratings, financed emissions calculations, portfolio alignment tools, climate scenario analysis, and sustainability-linked finance, and are used by frameworks and investor initiatives including CDP, the International Financial Reporting Standards S2 (IFRS S2) climate disclosure standard, the Partnership for Carbon Accounting Financials (PCAF), and the Transition Pathway Initiative (TPI). The risk is that underreported or misestimated emissions can propagate through these tools, leading to underestimated climate risk.
For investors, this may mean overstating the credibility of transition plans, misjudging financed emissions, or allocating capital without a complete picture of operational performance. For insurers, repeated large methane releases may signal infrastructure integrity or operational risks that are not fully reflected in reported disclosures, with implications for underwriting and risk pricing.
Independent satellite and aerial measurements add another layer of insight that can help investors and insurers monitor company-level emissions trends, identify potential discrepancies, and inform stewardship and engagement discussions with portfolio companies.
As satellite coverage expands and measurement technologies improve, these observations are likely to become an increasingly valuable complement to reported disclosures, offering a more robust view of company-level emissions risk.
The satellite-derived emissions data referenced in this article reflects observations and modeling as of the date(s) noted and is subject to inherent limitations in satellite detection technology. This content is provided for informational purposes only and does not constitute a definitive determination of emissions sources, volumes, or regulatory compliance. It should not be relied upon as the sole basis for any legal, financial, regulatory, or business decision. GHGSat Inc. makes no representations or warranties as to the accuracy, completeness, or currentness of this information as of the time of reading.
Ivana Petrich has 15 years of experience in institutional asset management and environmental, social, and governance (ESG) research, including nine years in London with PGIM Fixed Income, Insight Investment, Russell Investments, and BNY Mellon Investment Management EMEA, before joining energy technology firm Enverus. Ivana has most recently worked with GHGSat as a Senior Sustainability Analyst specializing in methane emissions, sustainable finance, and the energy transition. She is a CFA Charter holder.
Topics: Transition Risk, Climate Risk Management, Green Finance & Sustainable Business