Background and Purpose of the Study
The GARP Risk Institute’s study on how and why vendor physical risk assessments differ was published on October 23rd as part of the Climate Financial Risk Forum’s (CFRF) 2025 outputs.
GARP conducted a benchmarking study of 13 physical risk data vendors to understand the differences in their approaches to physical risk assessment at the asset level and to quantify the variation in their outputs.
This study comes at a time when financial institutions are facing growing regulatory and stakeholder pressure to integrate climate-related physical risks into their risk management processes.
The study is the first comprehensive, comparative assessment of vendor physical risk models, and focuses on how vendor estimates differ, the reasons for such differences, and practical lessons for financial institutions.
Context: Rising Physical Risks and Regulatory Expectations
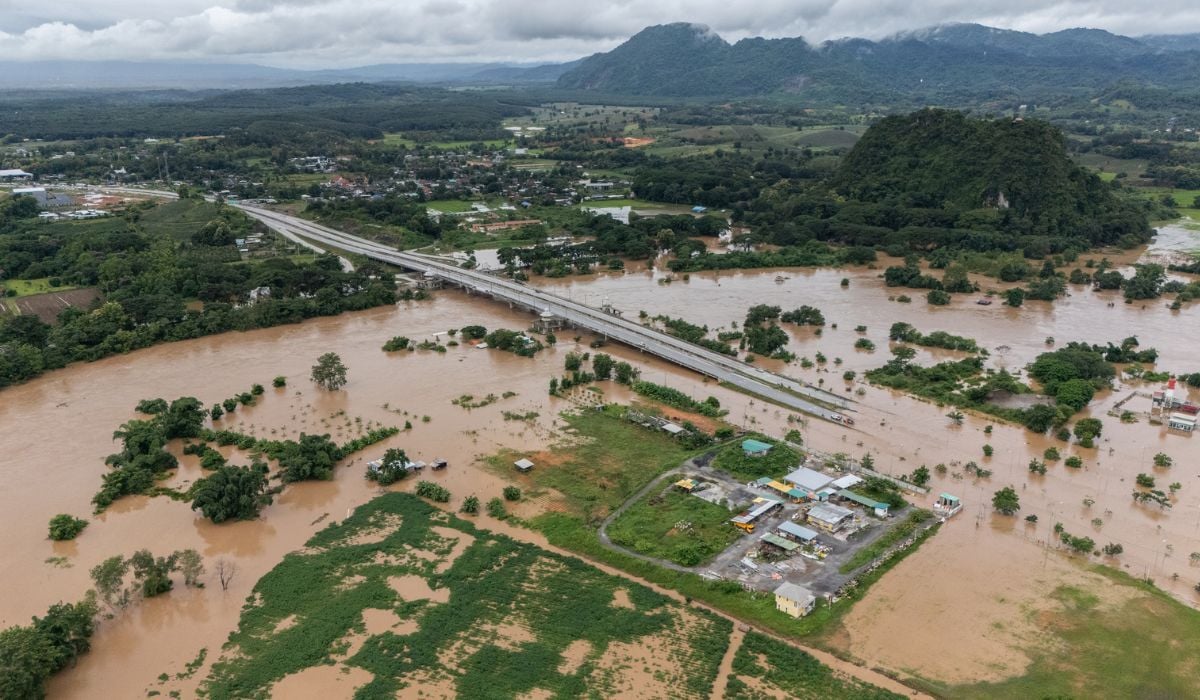
Climate change is driving an increase in the frequency and severity of physical risk events, such as floods, storms, and heatwaves. In 2024, the United States alone experienced 27 weather/climate disasters with losses exceeding USD 1 billion each — three times the annual average from 1980–2024.
While the overall risk is rising, quantifying the impacts on individual firms and assets remains complex and uncertain, requiring granular spatial analysis. Regulators are setting expectations for firms to embed climate risk considerations, prompting many to turn to third-party vendors for expertise and data.
Study Design and Methodology
The benchmarking exercise had three core components:
- A methodological survey to capture each vendor’s modelling approach and capabilities.
- An asset location survey to test how vendors allocate property locations when information is incomplete or vague.
- A physical risk quantification study, where vendors provided risk assessments for a set of 100 properties located in the UK, mainland Europe, the US, and Asia.
This structure allowed us to identify both quantitative differences in vendor outputs, and the methodological drivers of dispersion. The study focused on a high-emission scenario (RCP 8.5). Vendors were asked to estimate both hazards (e.g., flood depth, wind speed) and associated damages to each property.
Key Terms Defined
- Peril: Specific event causing loss (e.g., flood, wildfire).
- Hazard: The physical manifestation of a peril (e.g., flood depth).
- Exposure: What is at risk if a peril occurs (e.g., a home in a flood zone).
- Vulnerability: How susceptible an asset is to damage (e.g., construction material, age).
These concepts underpin the vendors’ risk assessments and are crucial for financial institutions seeking to understand and manage physical risk.
Findings: Dispersion and Drivers of Variation
Wide Dispersion in Vendor Estimates
The study found significant variation in both hazard and damage estimates across vendors. These variations highlight that even when vendors assess identical properties under the same scenario, methodological choices drive substantial dispersion. For instance, a property could be assessed as highly exposed to flooding by one vendor and not at all by another (Figure 1).
Figure 1: Defended Flooding Depths Across Properties For a one-in-200 year flood in 2030

As Figure 2 illustrates, there was also considerable variation in the damage ratios calculated for these properties.
Figure 2: Defended Flooding Damage Ratios Across Properties (RP200 in 2030)

This type of dispersion was observed for all perils, including coastal flooding, cyclone, windstorm, and heat.
There are many potential explanations for the spread, which are examined in the paper. For example, the modeling underpinning physical risk assessments is extremely complex, inevitably leading to differences in estimates. Beyond that, there are variations in the way in which global climate models are ‘downscaled’ (that is their where lower resolution outputs are refined to produce higher resolution climate information that can be used for regional or local analysis); differences in approaches to identifying a building’s location or perimeter; and also differences in the metrics reported by vendors.
As an example, we found that metrics varied considerably when measuring hazards. Those used for flooding were generally the most consistent, typically flood depths expressed in metres. The most common metric for tropical cyclone was wind speed — either kilometres per hour or meters per second. However, that could be measuring different things, such as sustained 1- or 10-minute winds or 3-second gusts. One vendor instead used the probability of a cyclone being a certain category on the Saffir-Simpson hurricane wind scale.
These type of differences made comparing vendors’ assessments of physical risk even more challenging.
Asset Location Data
Accurate asset location data is critical for meaningful risk assessment, particularly for hazards like flooding. So, the paper also looks at vendors’ approaches to geocoding through an asset location survey.
To test how geocoding varies, the vendors were provided with information on 20 properties, across the world, with differing degrees of completeness. For example, some properties had a full postal address, but no latitude or longitude; for others we might just provide the name of a factory or house, together with the town and country. The vendors were asked to supply the longitude and latitude details for each property as a way of testing the consistency in their geocoding approaches.
For each property we calculated the median longitude and latitude of the vendors’ submissions. The distance (in kilometres) between each individual vendor’s submission and the median value was then calculated. Figure 3 shows the dispersion in geocoding estimates (note the logarithmic scale needed because of the size of dispersion).
Figure 3: Dispersion in Vendors’ Geocoding

There were a few extreme outliers including:
- The largest dispersion was for property 16 where one vendor submitted coordinates that were 1507 km away from the median of the others. The name of a well-known store in Boston was provided for the property, but the submission was for a similarly named road in Atlanta.
- Dispersion was particularly high for property 14 — an address in the Philippines.
While this was a small sample of properties, it’s clear that the completeness and accuracy of asset location data provided to the vendors may have a material impact on the results.
Checklist for Financial Institutions
The report provides a practical checklist of questions for firms in selecting and validating physical risk vendors, including:
- What is the intended use case (e.g., site-level, portfolio-level, adaptation planning)?
- Does the vendor cover relevant geographies and hazards?
- Is asset data (location, characteristics) of sufficient quality?
- What scenarios, time horizons, and reporting frequencies are needed?
- What granularity of modelling is appropriate?
- Are the metrics and outputs suitable for decision-making?
- How does the vendor handle model validation?
- What measures of uncertainty are provided, and are they meaningful for your use case?
Engagement with vendors on these questions is essential to ensure that selected solutions align with regulatory requirements and internal risk frameworks.
Conclusions
The GARP benchmarking study for the CFRF reveals the complexity, uncertainty, and diversity in physical risk assessment at the asset level. There is no “best” vendor or model; rather, the suitability depends on the user’s specific needs, data quality, and intended application.
The study focuses on direct hazard impacts on selected properties, not accounting for indirect or systemic effects (e.g., supply chain disruptions, migration, second-order impacts). It also does not cover the full range of possible perils or all aspects of vulnerability (e.g., contents loss, business interruption for all asset types). The findings underscore the need for financial institutions to build internal capacity and collaborate with vendors and the wider research community to address these broader risks.
As climate risks rise and regulatory and disclosure expectations grow, financial institutions must enhance their understanding of physical risk modelling, engage proactively with vendors, and improve their own data and analytical capabilities. While the field is still evolving, transparent engagement and robust due diligence will help institutions make meaningful, actionable use of physical risk assessments.
Jo Paisley, President, GARP Risk Institute, has worked on a variety of risk areas at GARP Risk Institute, including stress testing, operational resilience, and model risk management. Her focus is now climate and environmental financial risk management. She hosts the GARP Climate Risk podcast. Her career prior to joining GARP spanned public and private sectors, including working as the Director of the Supervisory Risk Specialist Division within the Prudential Regulation Authority and as Global Head of Stress Testing at HSBC.
Topics: Physical Risk, Climate Risk Management, Nature Risk Management