
The GARP Risk Institute’s latest deep dive on climate scenario analysis practices in financial firms was recently published on December 9 as part of the Climate Financial Risk Forum’s (CFRF) 2022 outputs, which are all accessible via this link.
This publication offers an update to last year’s CFRF Scenario Analysis Implementation Guide, with a focus on the maturity of fast-evolving climate scenario analysis practices in financial firms.
GARP has been secretariat for the CFRF’s working group on climate scenario analysis since the Forum was established in 2019 by the UK’s Financial Conduct Authority (FCA) and the Prudential Regulation Authority (PRA). The CFRF aims to build capacity and share best practice across financial regulators and industry, with guides written by industry for industry.
If you would like to hear more about some of this year’s CFRF outputs, you can also listen to a podcast we recently recorded discussing CFRF’s Litigation Risk and Physical Risk Underwriting Guides.
Background and Context

Climate scenario analysis has been greatly influenced by regulation and the regulatory agenda over the past year, and is now in wide use at financial firms. Indeed, firms are employing it more frequently to assess the financial impacts of climate change and to improve risk management and disclosure, but there is still more work to be done – particularly with respect to firms taking action in response to scenario analysis.
This chapter presents results of a deep dive on the maturity of fast-evolving climate scenario analysis practices in financial firms, offering an update on the analysis published in last year’s CFRF Scenario Analysis Implementation Guide. It sheds light on emerging practices and gives firms a tool for measuring the maturity of their own approaches relative to their peers.
The analysis presented here is based on the results from GARP’s Fourth Climate Risk Management Survey (“GARP Annual Survey”) undertaken in Q2 2022. The 2022 GARP Annual Survey comprised 62 firms, which collectively had around USD43 trillion of assets on their balance sheets, managed assets of close to USD46 trillion, and accounted for about USD3.2 trillion in market capitalization.
Just over 80% (51) of these 62 firms have undertaken climate scenario analysis. The analysis presented in this deep dive focuses on the practices at these 51 firms; any percentages presented are of a total population of 51 firms, unless otherwise stated.
Any year-on-year comparisons will reflect a mix of evolving practices and changes in the population of participating firms. Fortunately, the populations in the two years of deep dives are similar in terms of the proportions of firm types (around 65% banks, 35% asset managers and insurers) and their geographic footprint. Seventy-three percent of the firms (37 of 51) in this year’s deep dive, moreover, were in last year’s.
Key Takeaways

The rising influence of the regulator is evident throughout this year’s deep dive, but we also saw interesting developments across areas like motivation, outcome, and scope. Let’s now take a look at the most important findings.
- Regulation: There has been a marked increase in the proportion of firms being required to undertake climate scenario analysis for regulatory purposes, and several of aspects of the survey – including the motivation, usage and scope – have been influenced by the regulatory agenda. Consistent with the rising regulatory scrutiny, the Network for Greening the Financial System (NGFS) is now the most popular provider of scenarios for financial institutions.
- Motivation: Risk identification and assessing the financial impacts of climate change remain the most popular reasons to undertake climate scenario analysis. Physical risk (assessed by 98% of firms) was a slightly more popular focus than transition risk this year, which, similar to last year, was evaluated by 94% of respondents. Though it still lags many of the other motivations, assessing the alignment of a portfolio to a particular temperature pathway (including whether it will be net-zero emissions in the future) is an increasingly popular reason for undertaking scenario analysis.
- Scenarios Used: Firms continue to use different scenarios to focus on particular risks, with the most popular choice being that a scenario covered the risks that could arise if the Paris Agreement objectives are met. This year we saw a sizable increase in the number of firms that use a baseline scenario against which to assess impacts of climate change, rising from 38% of respondents in 2021 to 65% in 2022.
- Frequency: More firms are now using scenario analysis on an ad hoc basis (roughly 70%), rather than regularly (55%), possibly reflecting the growing number of regulatory climate scenario analysis exercises, which firms may see as “ad hoc.”
- Outcomes: Similar to last year’s survey, changing risk management and improving disclosure were the most popular actions taken as a result of scenario analysis – but it’s also being used to implement revisions in products and services, organizational strategy, and portfolios. Surprisingly, though, fewer firms are acting on the information yielded by scenario analysis, even though a broader range of potential actions was evaluated.
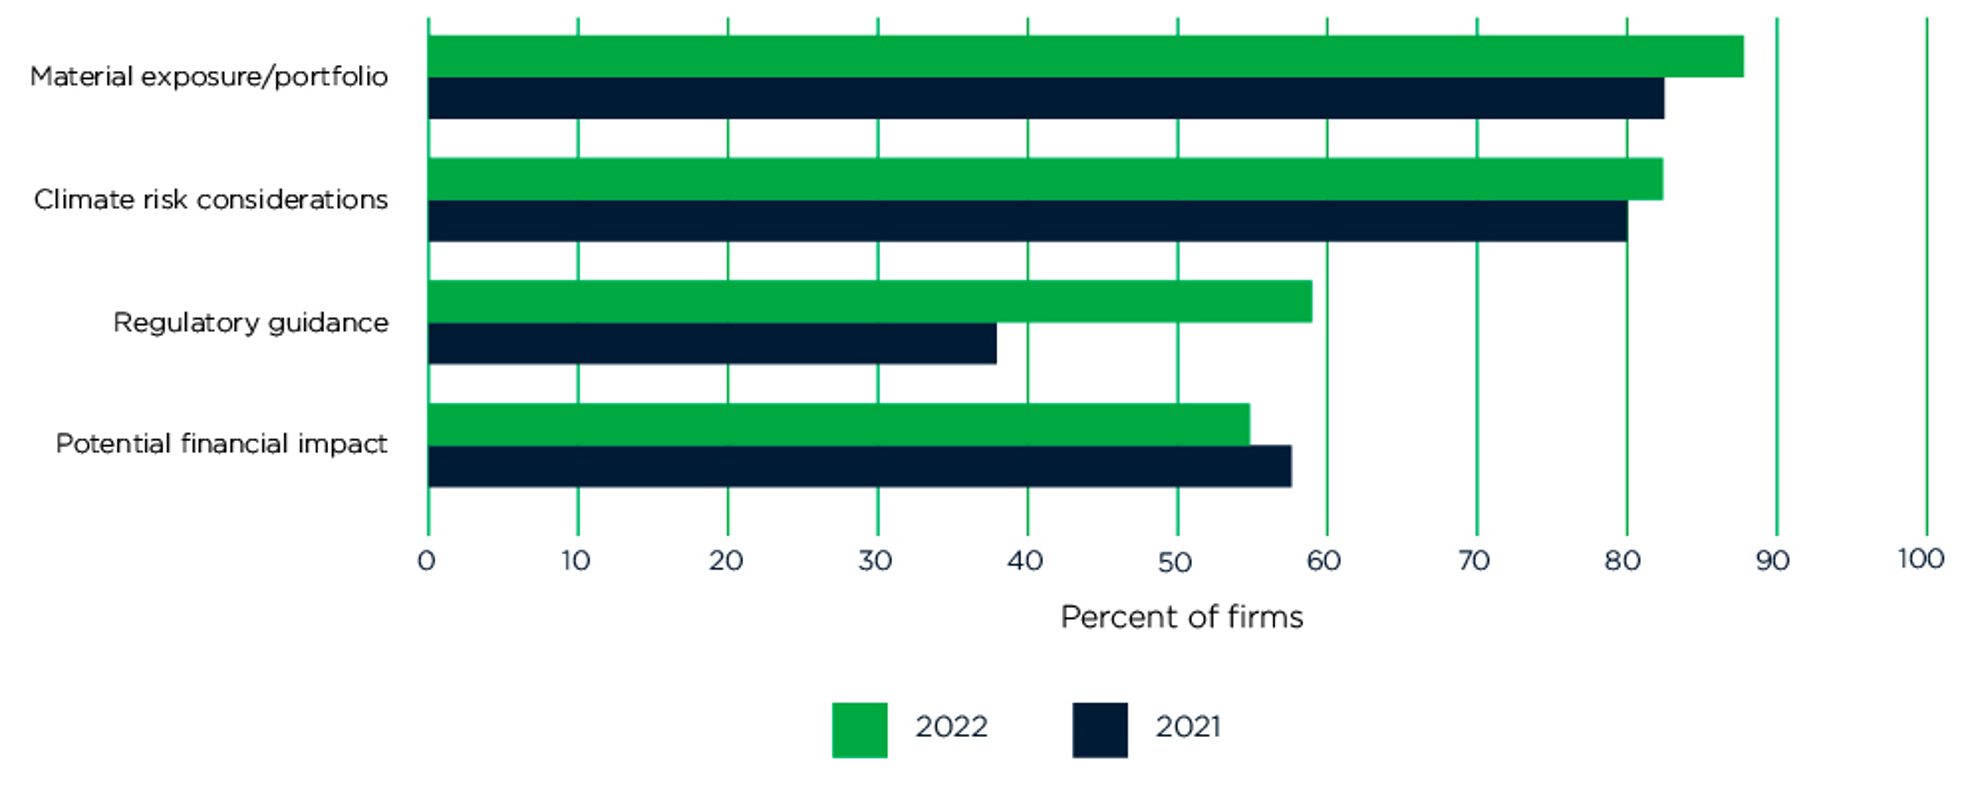
- Scope: Nearly 90% of respondents focus their analysis on their most material exposures or portfolios, with 82% of firms using climate risk considerations to decide on the scope of the analysis. There is also a wide range in the scenario analysis coverage of portfolios: nearly 40% of respondents use it to cover more than 75% of their business, whereas a further 50% or so cover somewhere between 26% and 75%.
The Use of Climate Scenario Analysis in Financial Firms

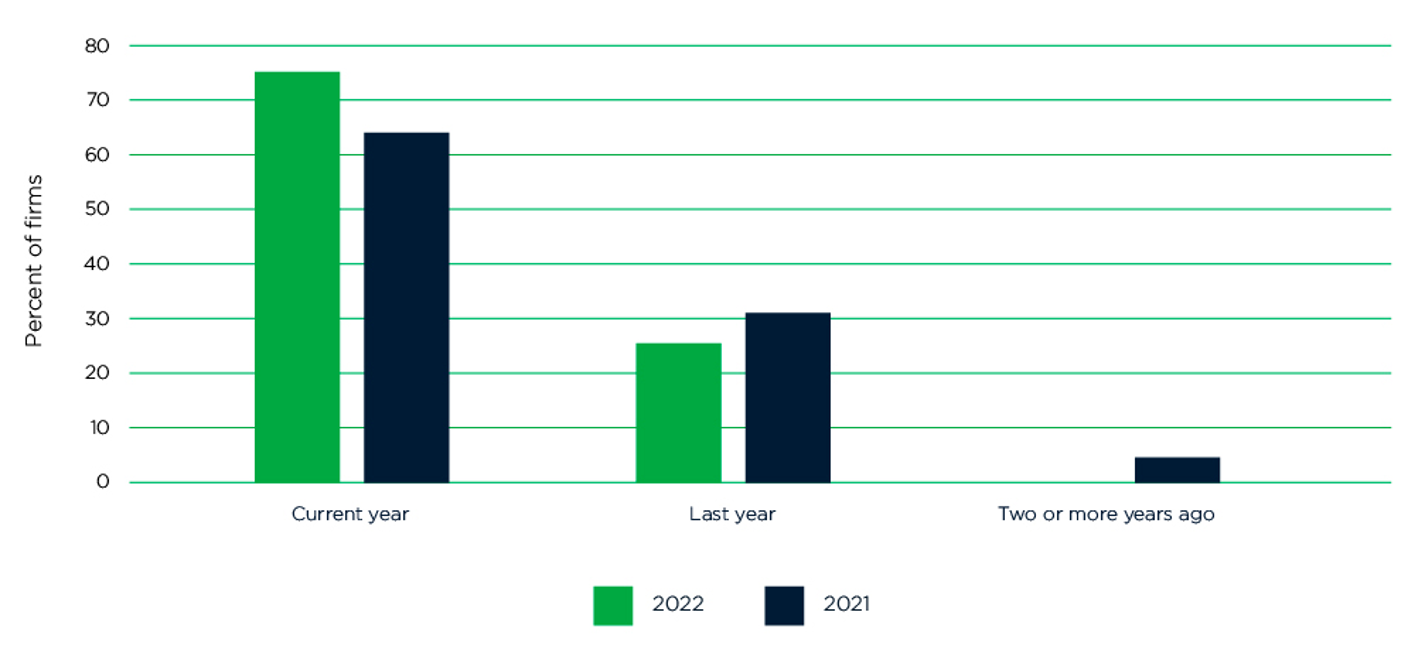
This year, a higher proportion of firms have undertaken scenario analysis more recently compared with the 2021 sample, with 75% applying it within the last year (Figure 1).
Figure 1: Time of Most Recent Climate Scenario Analysis
We asked firms whether their use of scenario analysis was regular or ad hoc. In a reversal from last year, more firms are now using it on an ad hoc basis (nearly 70%) and fewer (55%) are deploying it regularly (Figure 2). This trend may reflect in part the growing number of regulatory climate scenario analysis exercises, which firms may see as “ad hoc.”
As we noted last year, “regularly” does not necessarily translate to a high frequency of analysis. However, given that all the firms in this year’s sample have undertaken the analysis within the last two years, it is a good indication that regularly implies a reasonable frequency.
Figure 2: Use of Climate Scenario Analysis
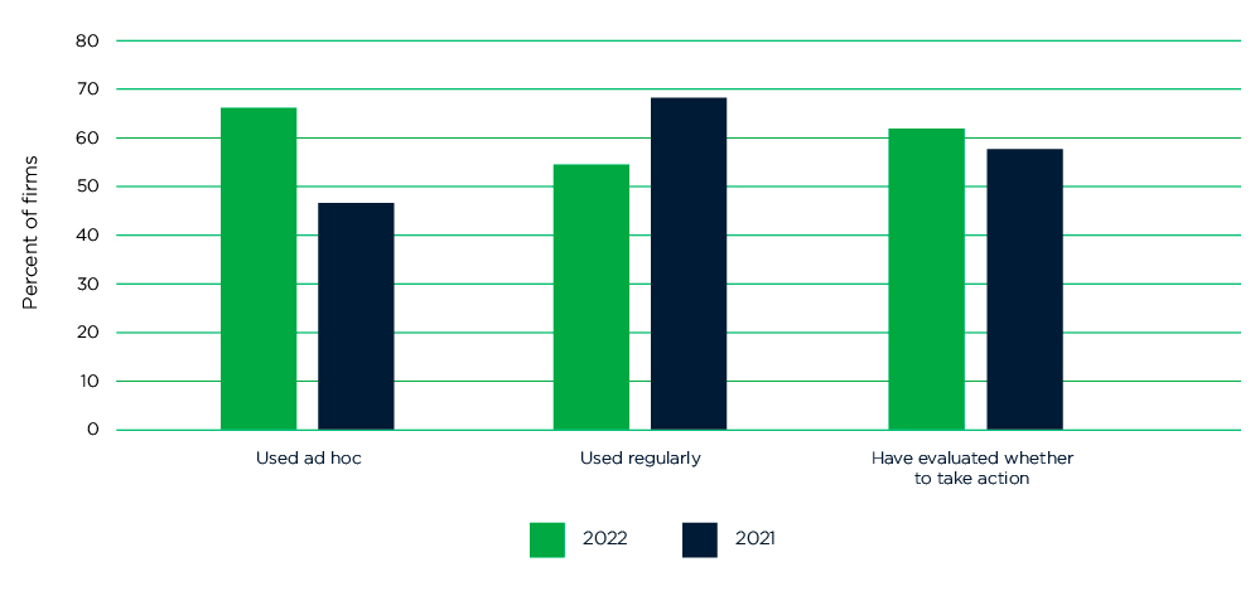
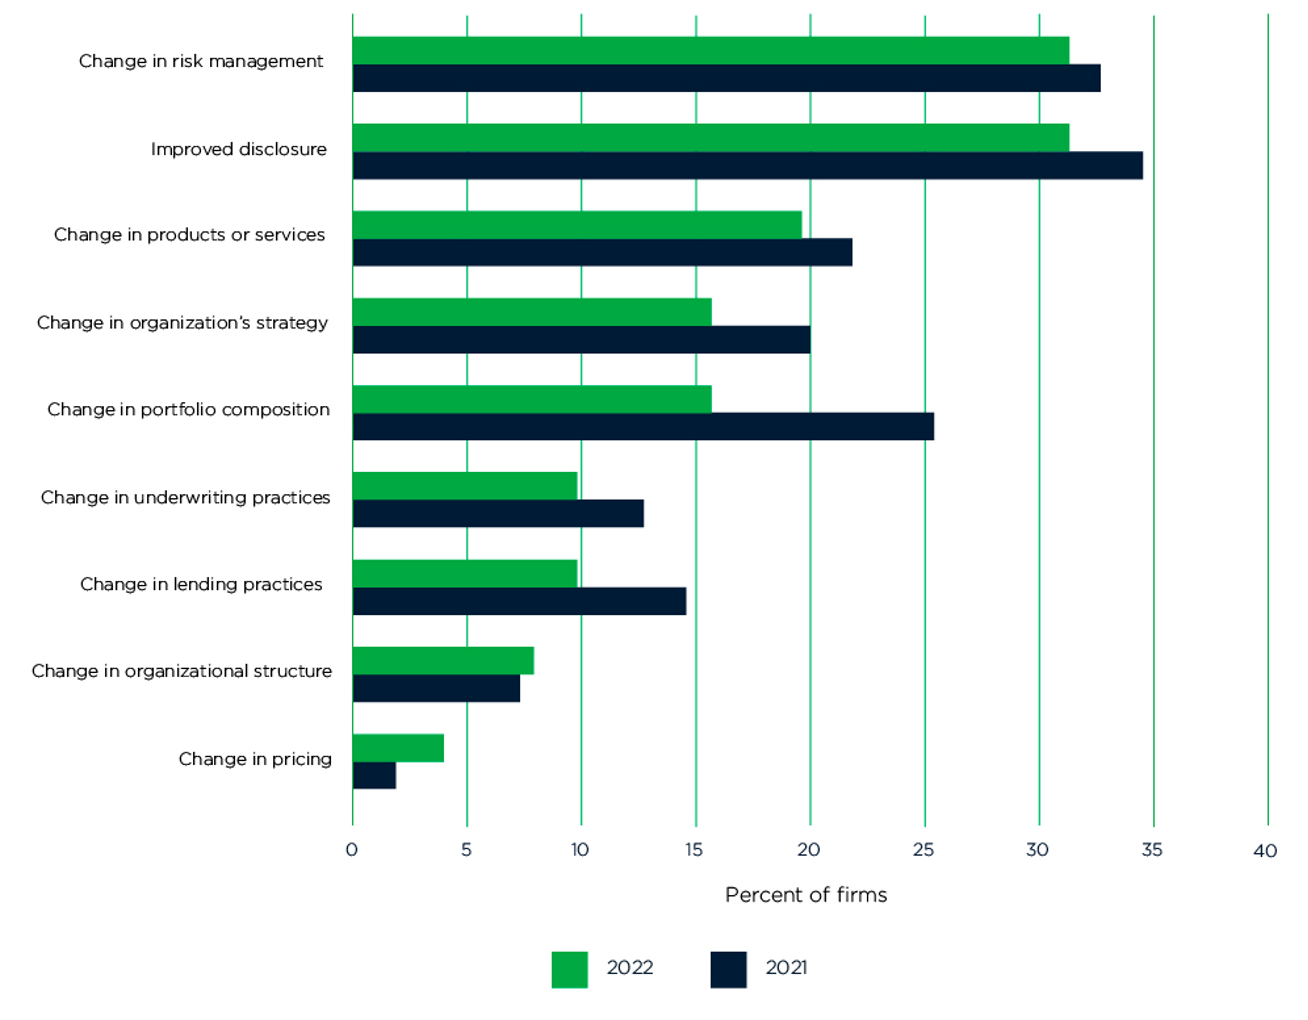
There has been a marginal increase in the percentage of firms evaluating whether to take action (Figure 2). But that evaluation is not necessarily flowing through to firms actually taking action, with a smaller percentage of the firms are doing so than last year (Figure 3). Similar to last year’s survey, improving disclosure and changing risk management were the most popular actions resulting from scenario analysis in 2022.
Figure 3: Actions Taken as a Result of Using Scenario Analysis
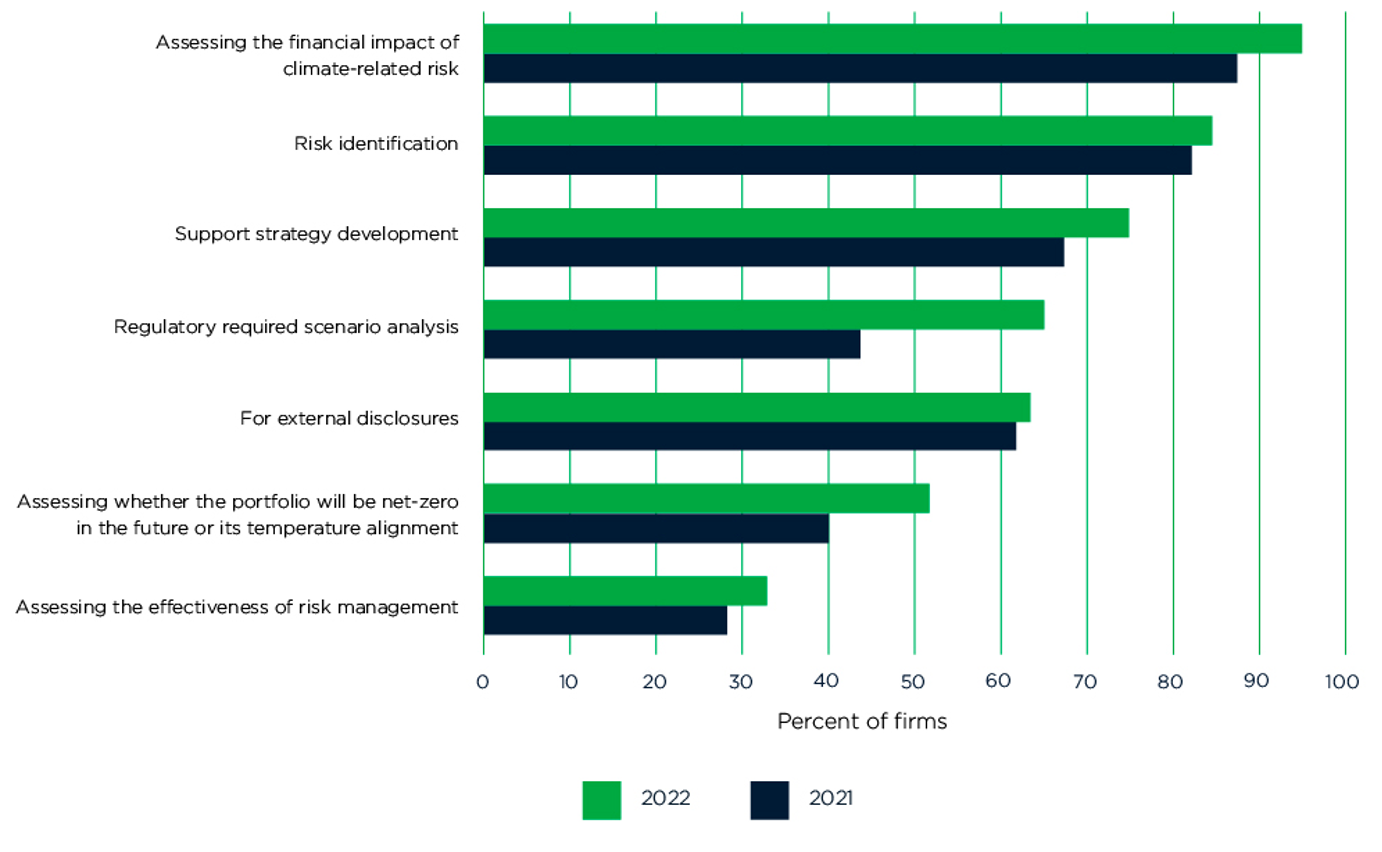
There are a range of reasons that firms choose to undertake climate scenario analysis (Figure 4). As in last year’s survey, the most popular reasons were: (1) assessing the financial impacts of climate change (94%); and (2) risk identification (84%). This year, moreover, there has been a marked increase in the percentage of firms being required to undertake scenario analysis for regulatory purposes, rising from 44% to 65%.
Firms also use scenario analysis to support their strategy development and to feed into external disclosures. Though it still lags many of the other reasons, assessing the alignment of a portfolio to a particular temperature pathway (including net zero) is another increasingly popular reason for undertaking scenario analysis.
Figure 4: Reasons for Undertaking Scenario Analysis
Relative prioritization is confirmed in Figure 5, which shows that firms are much more likely to use scenario analysis to assess physical or transition risk than to assess portfolio alignment. Physical risk (assessed by 98% of firms) was a slightly more popular focus this year than transition risk (94%), while portfolio alignment was the focus in 55% of all analyses.
Figure 5: Focus of Assessment
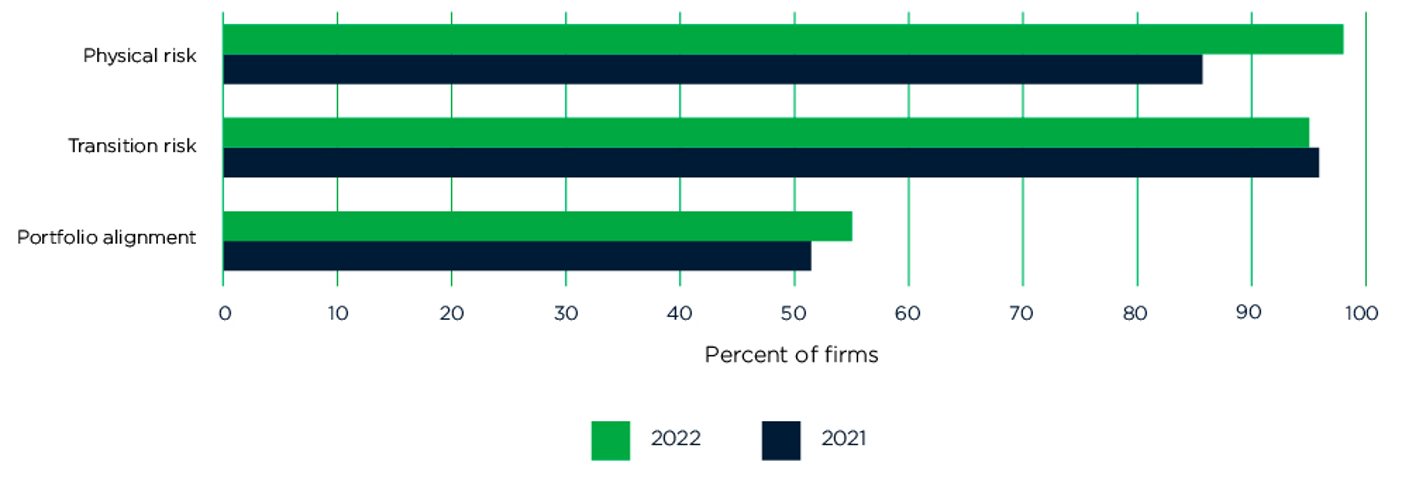
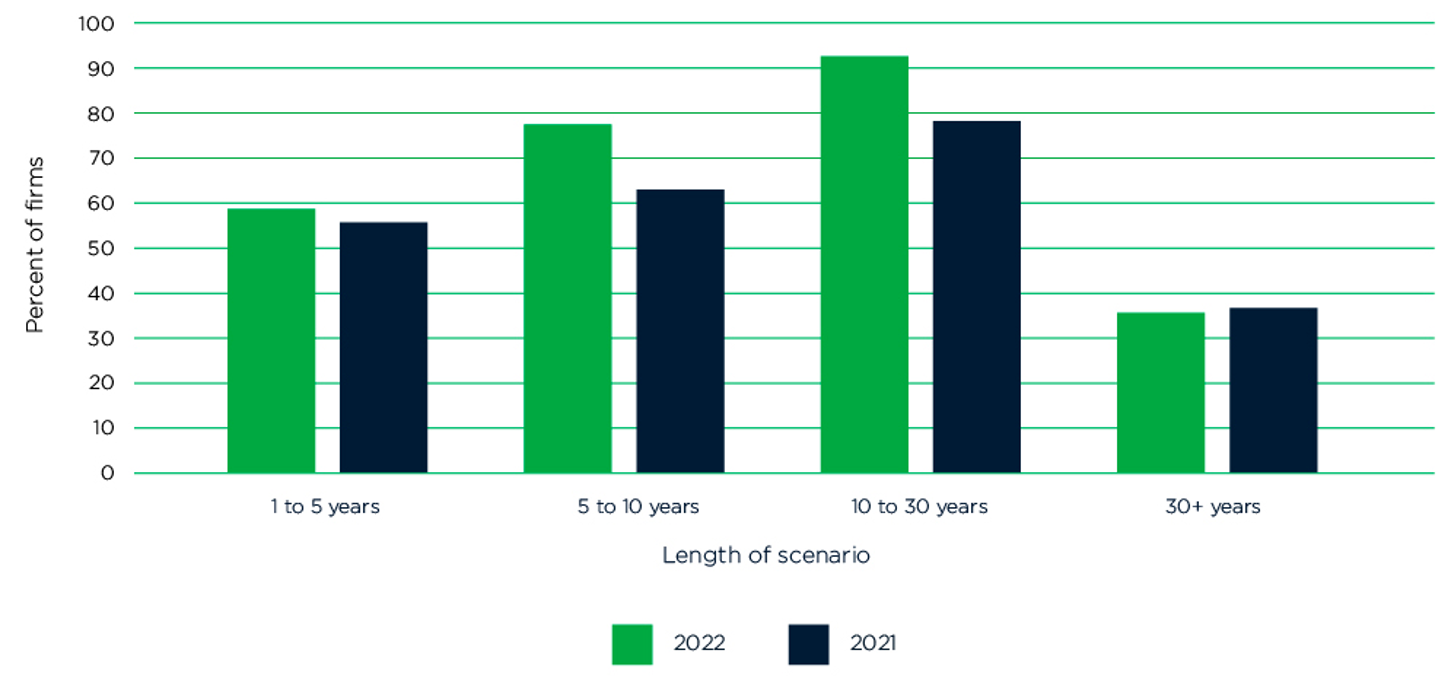
Figure 6 shows that the most popular time horizon for the scenarios used is 10 to 30 years, as it was in 2021. The longer time scales tend to be needed more for physical risk assessments than for transition risk.
Figure 6: Time Horizon of Scenarios Used
Firms can choose reference scenarios provided by third parties or develop bespoke ones to suit their particular business. Figure 7 shows the scenario providers most commonly used in 2022 and 2021. The most striking difference is the increase in the NGFS scenarios, which proved most popular in 2022 – accounting for nearly 40% of usage. This finding is consistent with the rise in the regulatory focus of climate scenario analysis. (For more details, see, in the Annex, “A Primer on Scenario Providers.”)
Figure 7: Main Families of Climate Scenarios Used by Financial Firms
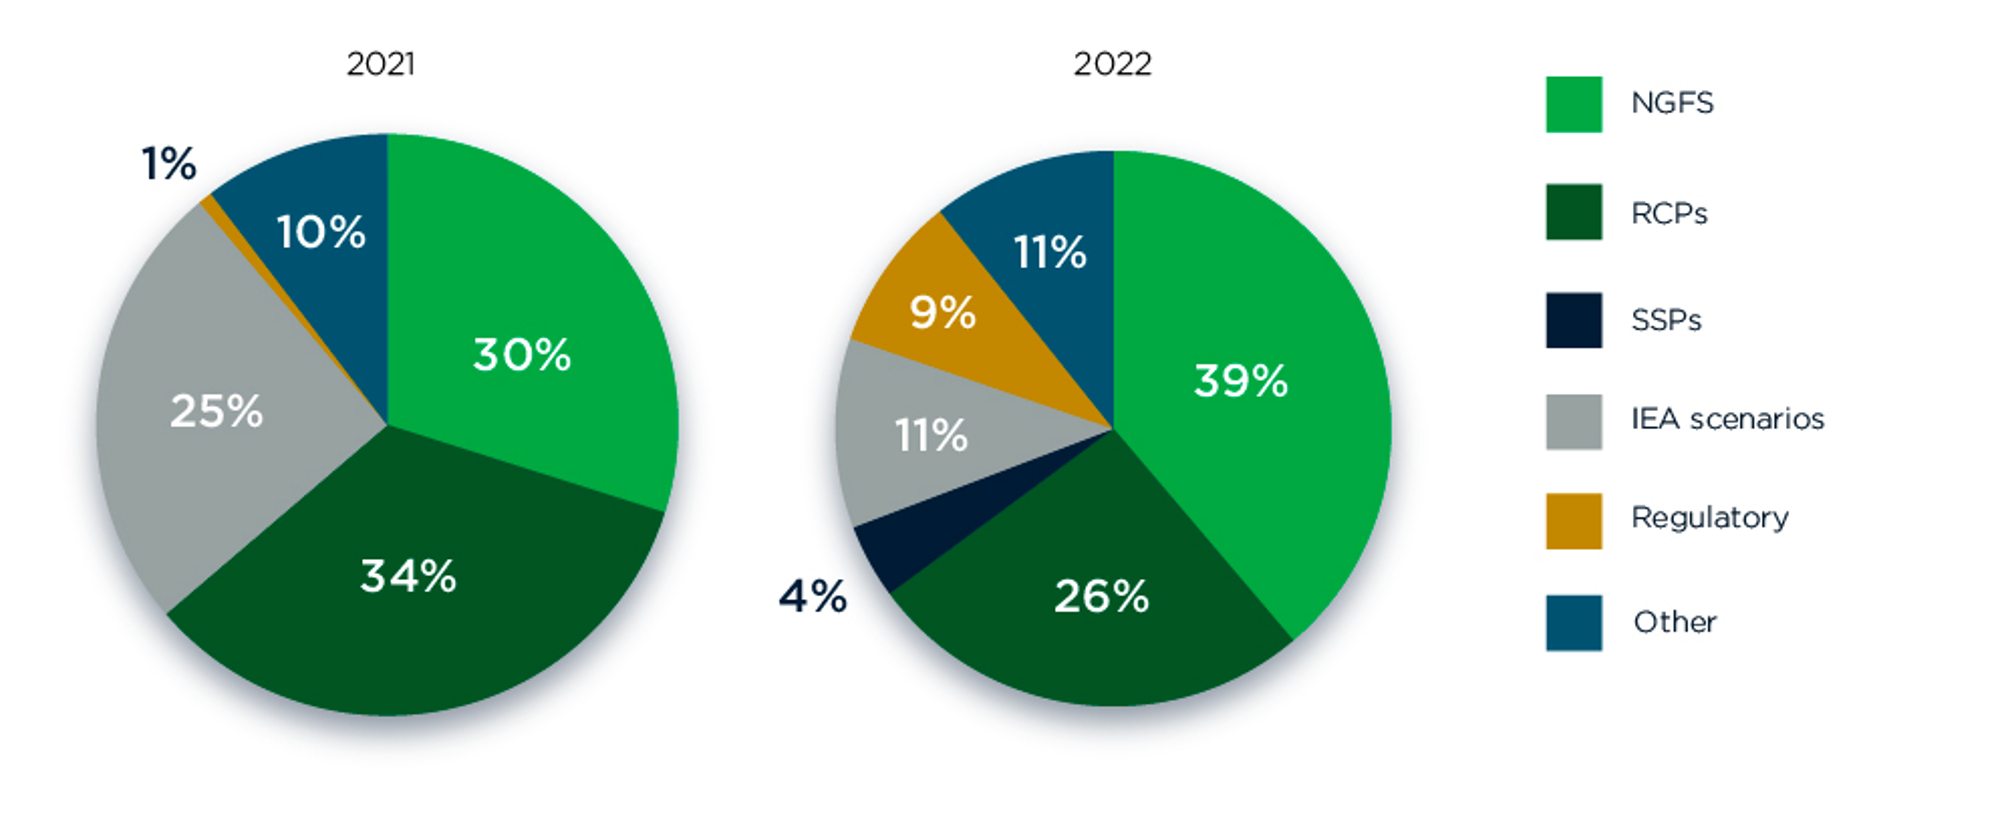
Note: Figures expressed as a proportion of the scenarios used. SSPs are those published in the AR6 (see Annex)
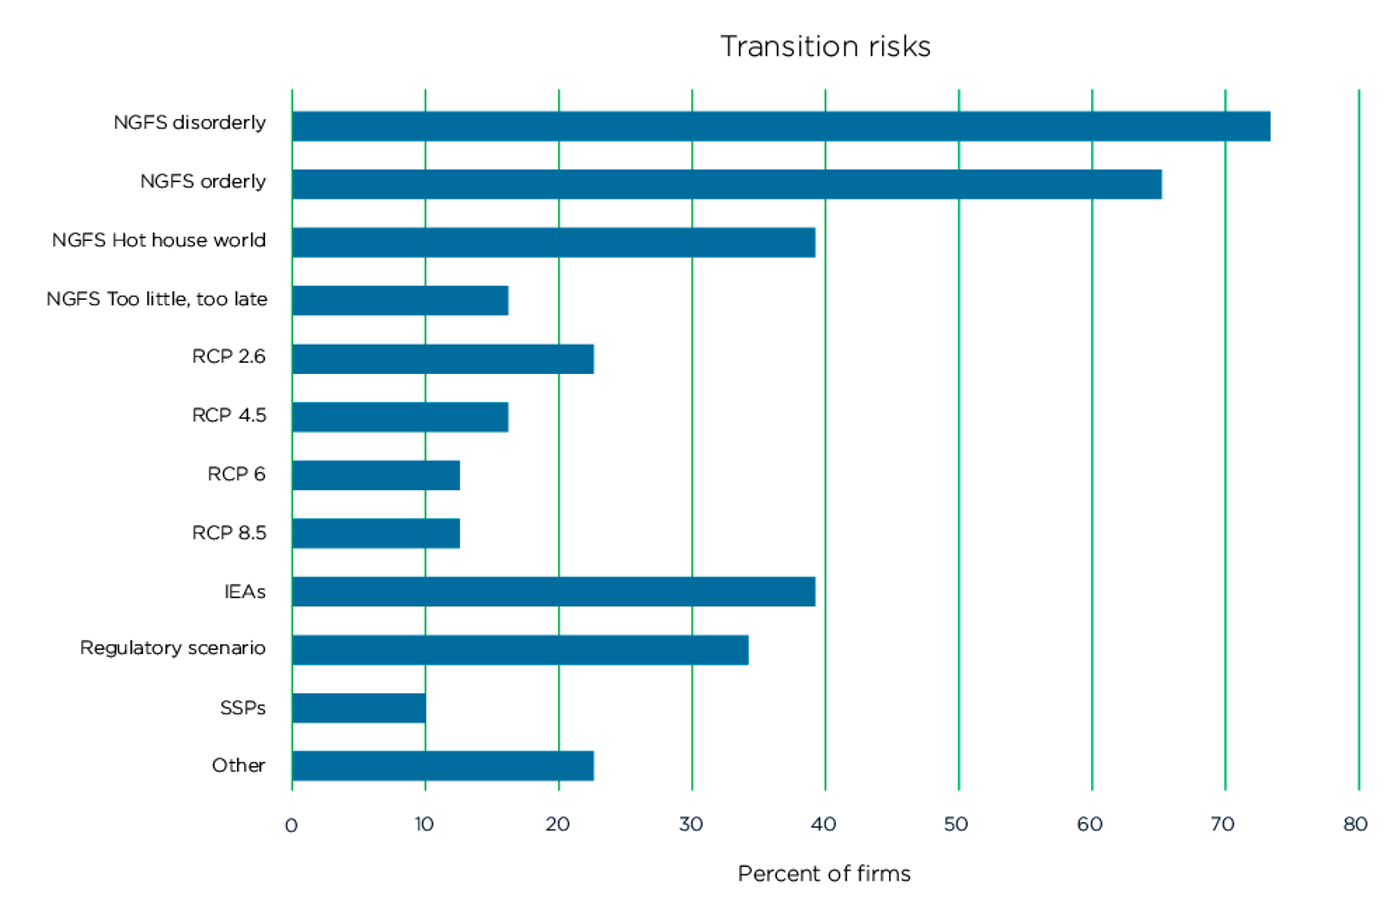
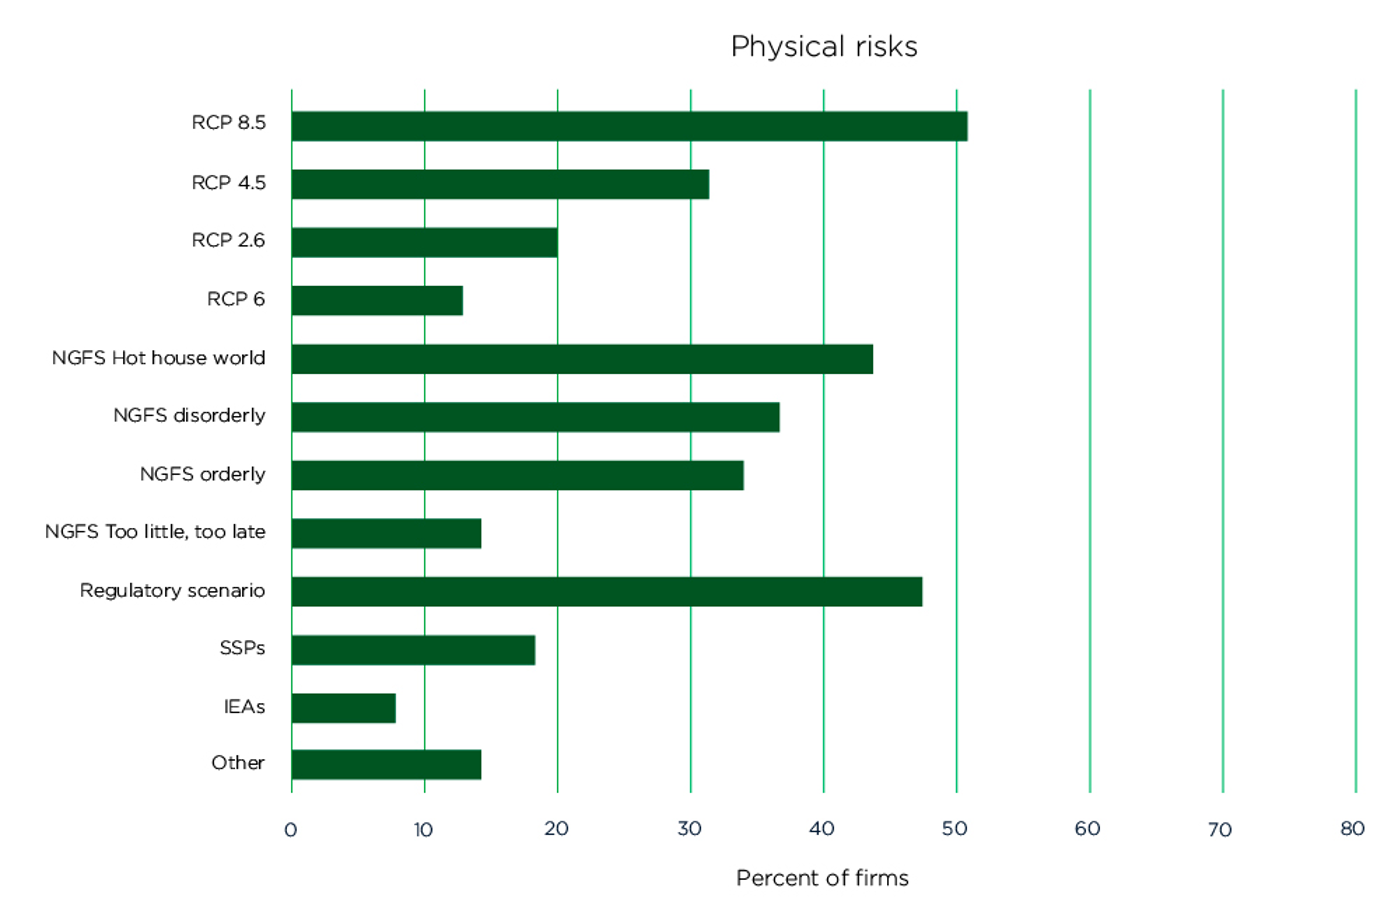
Different scenarios are suitable for assessing different risks. As Figure 8 shows, the most popular scenarios for assessing transition risks are the NGFS disorderly, orderly and hot-house world scenarios. For physical risks, the most widely used are the IPCC’s Representative Concentration Pathway (RCP) 8.5 and the NGFS hot-house world and disorderly scenarios.
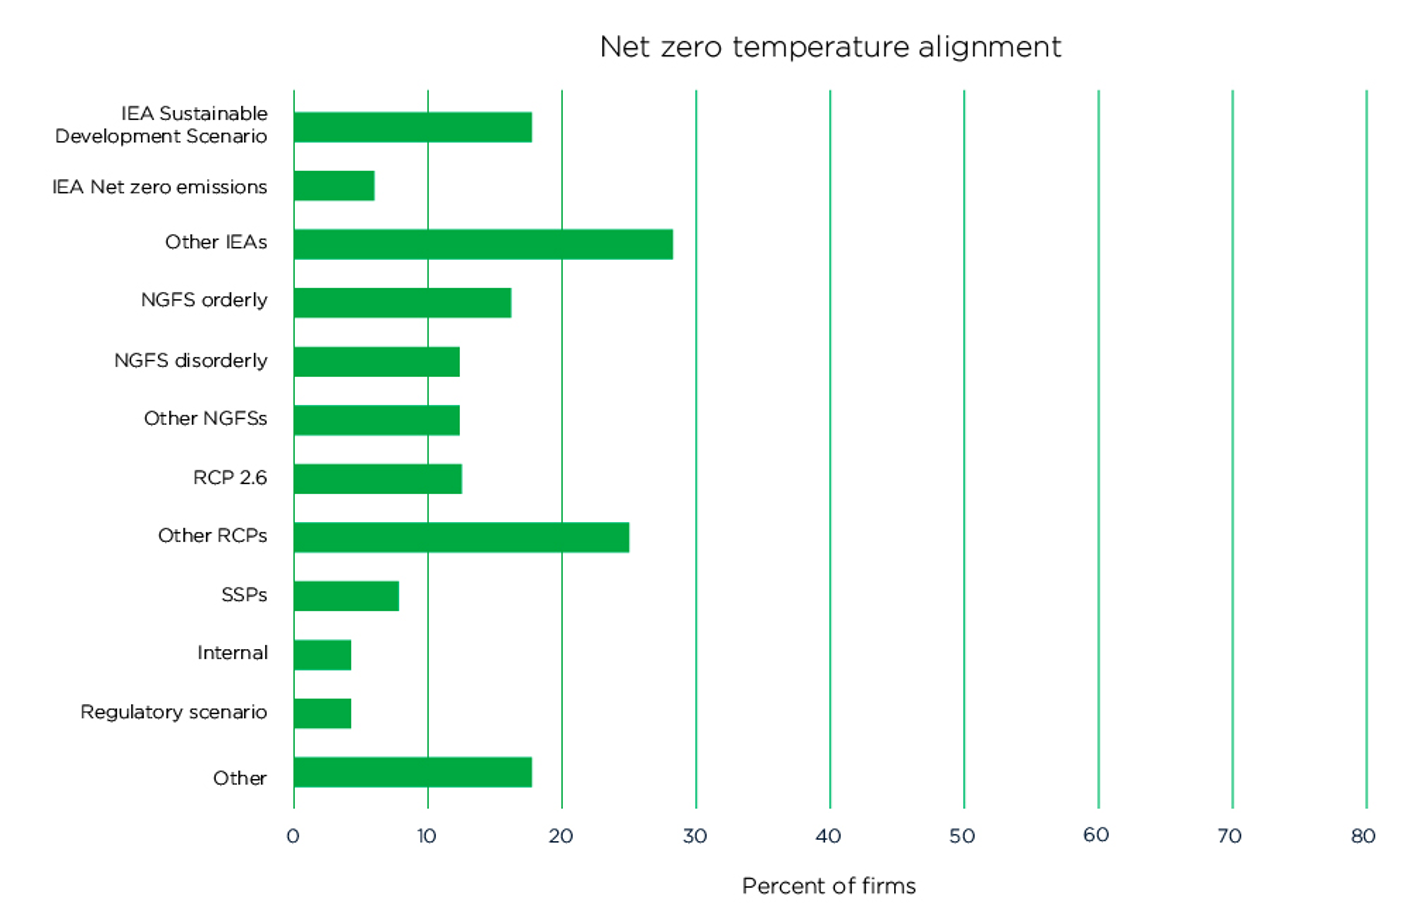
A smaller percentage of firms use scenario analysis for assessing alignment to net-zero or a particular temperature trajectory. The most popular scenarios for this purpose are the IEA Sustainable Development (SDS) scenario, followed by the NGFS orderly and disorderly scenarios.
Figure 8: Most Common Scenarios Used by Purpose
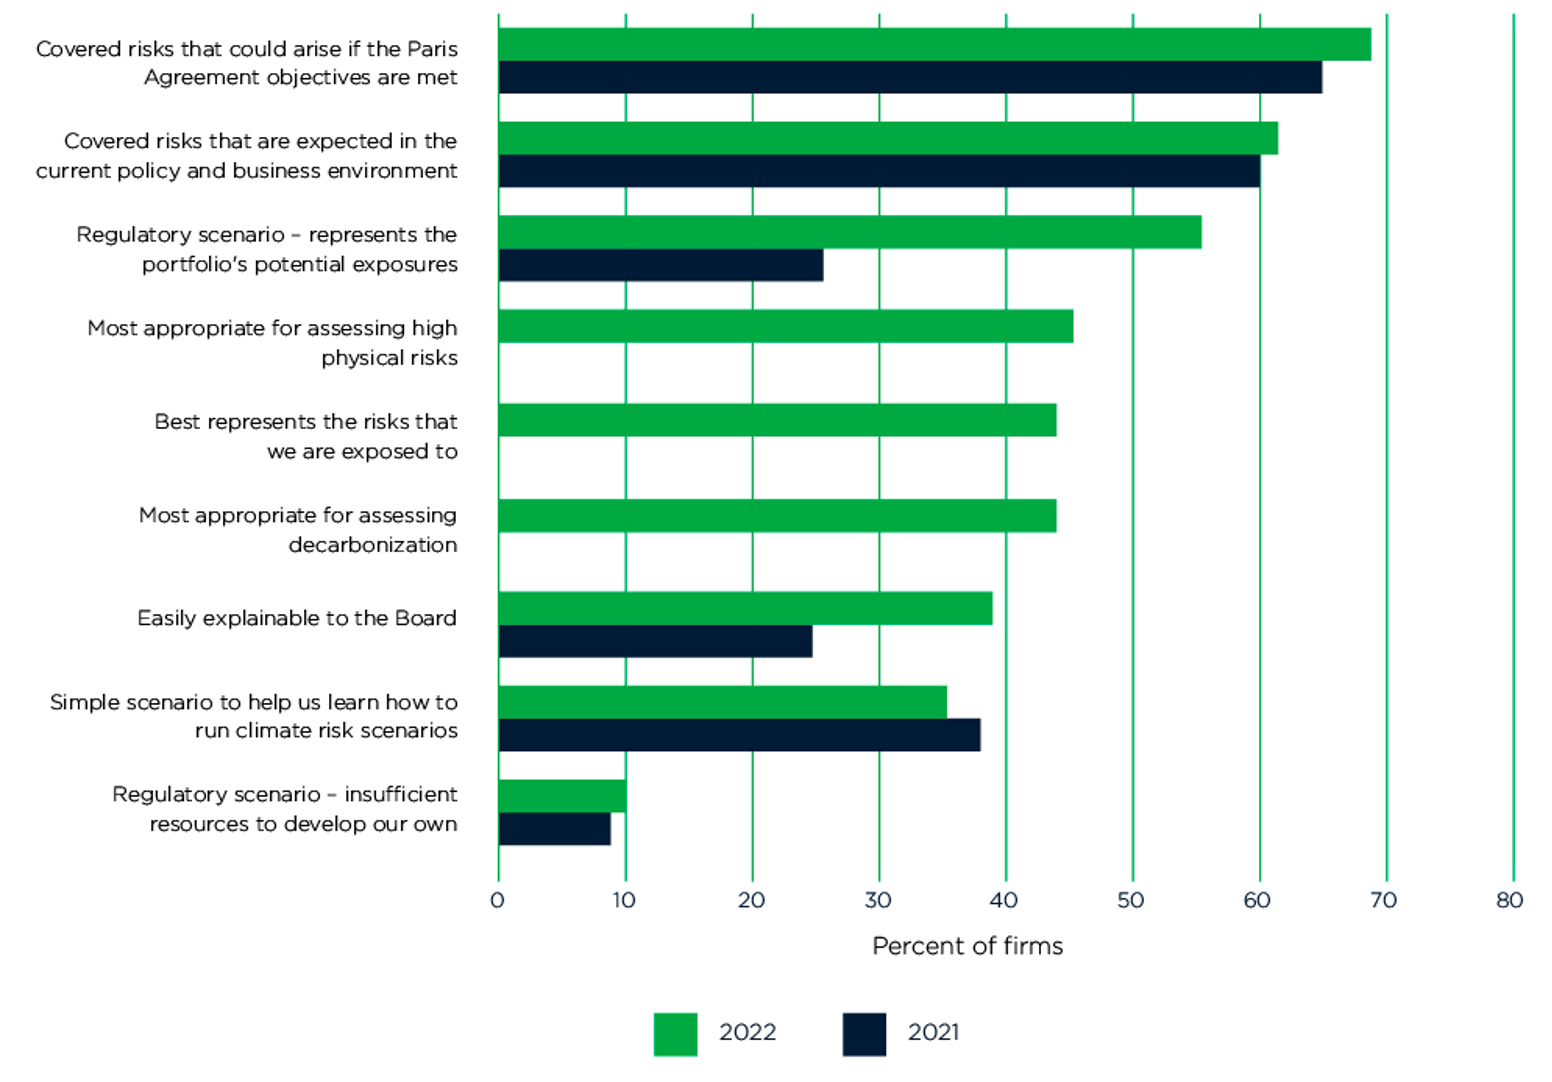
Firms have a range of criteria for choosing a particular scenario (Figure 9). As in last year’s survey, the most popular reason for choosing a scenario was that it covered the risks that could arise if the Paris Agreement objectives are met. Nearly as popular were scenarios that covered the risks that were expected in the current policy and business environment.
This year, we expanded our range of criteria, reflecting feedback from the firms in last year’s survey. Around 45% of firms in 2022 chose scenarios because they were particularly good for physical or transition risks, and a similar number selected them because they were best suited to their own portfolios. An increasing number of firms also selected scenarios because they were easy to explain to the board.
Figure 9: Criteria Behind the Choice of Scenario
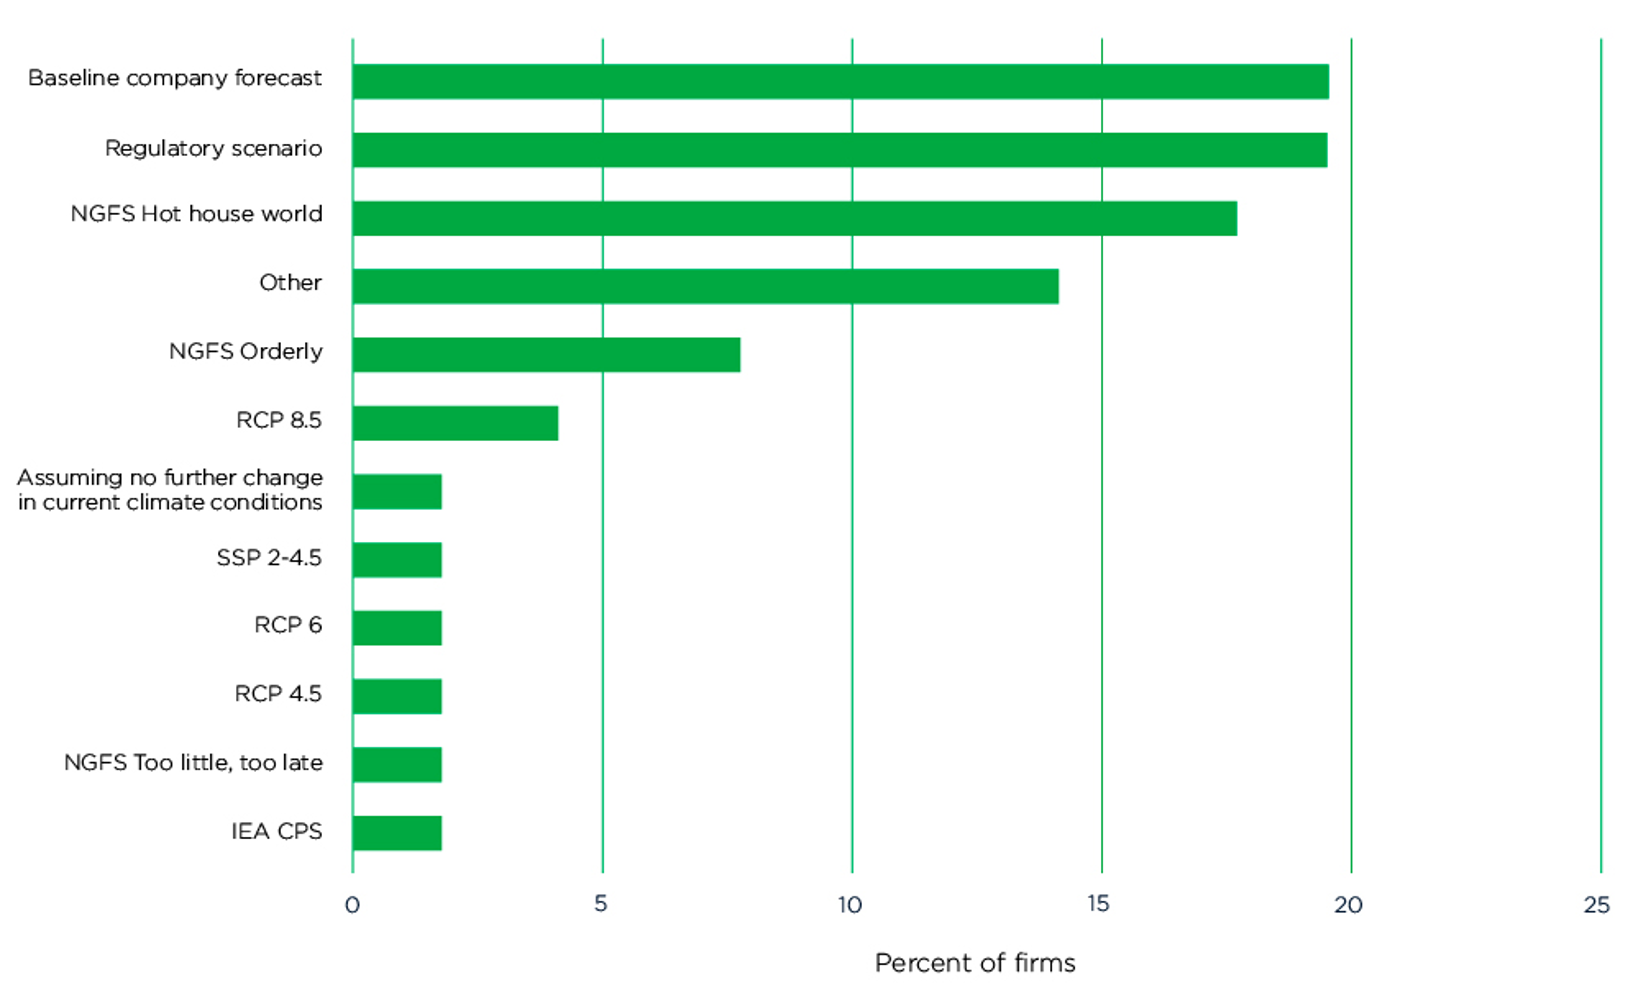
Last year, we noted that firms might also choose to run a scenario as a “baseline” against which to assess impacts. This year, just under 65% report using a baseline (considerably higher than last year’s 38%), indicating that this may be becoming a more widespread practice.
Figure 10 shows the relative popularity of using different scenarios as baselines. The most common approach is for a firm to simply use its baseline company forecast, with regulatory scenarios being the second most common choice.
Figure 10: Choice of Baseline Scenario
Whichever baseline scenario is chosen will affect the interpretation of any results: for example, transition risks will seem more severe if they are judged relative to a baseline scenario (such as the NGFS hot house world scenario) with high physical risks/low transition risks, rather than a scenario that focuses on transition.
Firms differ in how they focus their analysis. As Figure 11 shows, nearly 90% of the firms undertaking climate scenario analysis focus on the most material exposures or portfolios, ahead of the 82% citing climate risk considerations (e.g., highly vulnerable portfolios). Consistent with the increase in regulatory interest, we see more firms citing regulatory guidance as determining the scope. Ten percent of firms mentioned other reasons, including data availability, client demand, and coverage of the third-party platforms they are using.
Figure 11: Most Common Factors Driving Decisions on the Scope of Scenario Analysis
In a new question that was added to the survey this year, we asked firms what proportion of their portfolios were covered by the analysis. Firms were allowed to pick whatever denominator made the most sense for their business – for example, it might be assets under management for an asset manager, total lending for a bank, and premiums written for an insurance company.
Figure 12: Proportion of Portfolios to Which Scenario Analysis Is Applied
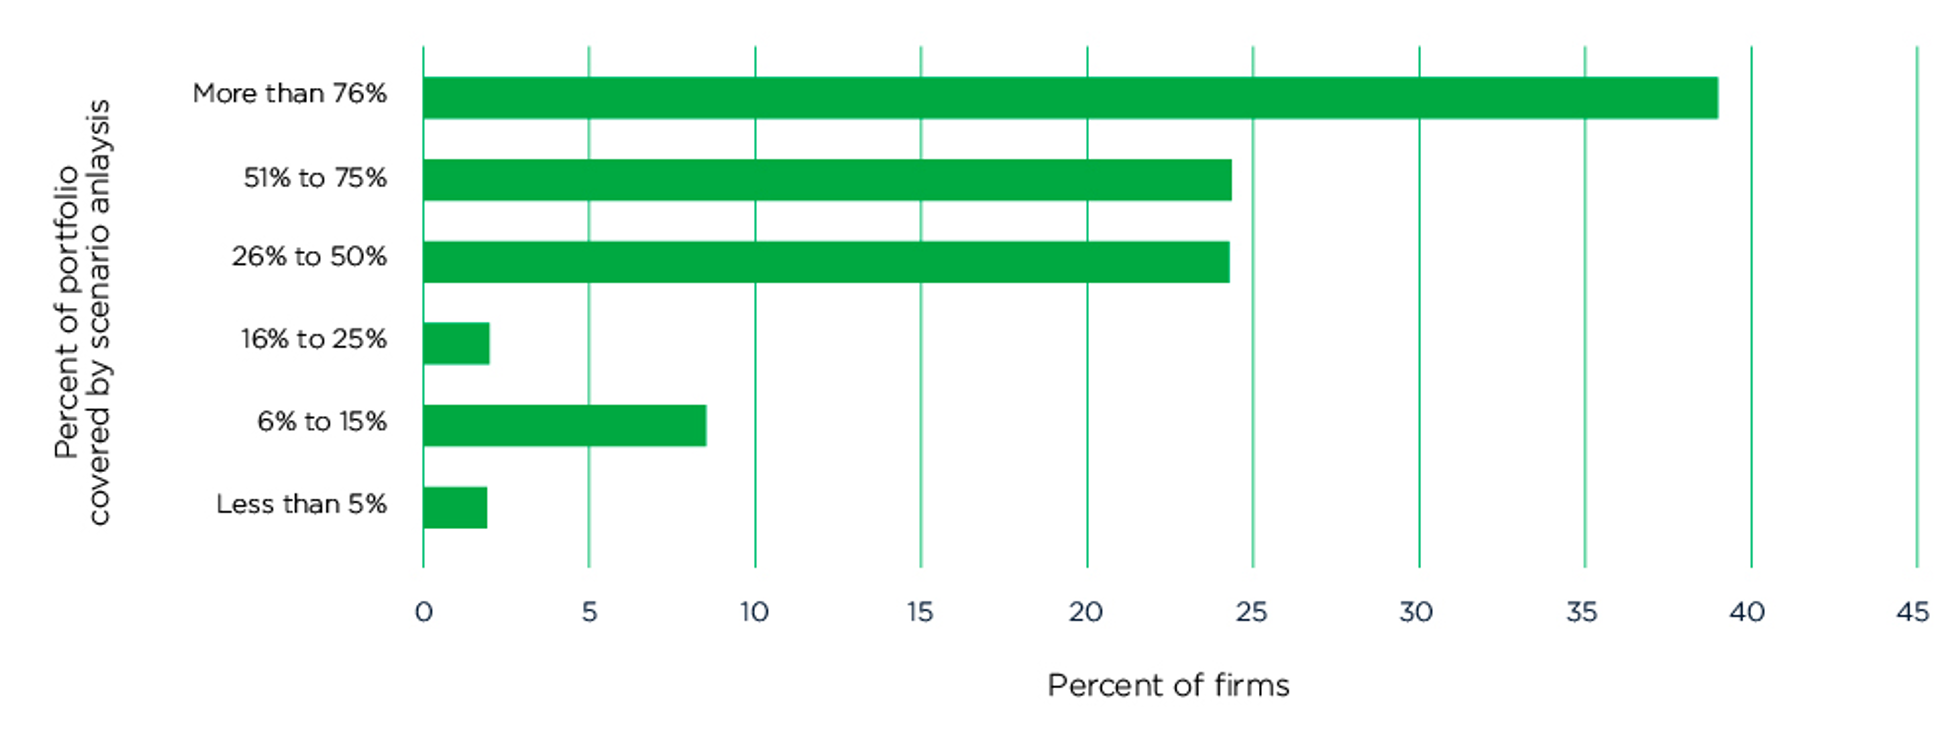
Note: This figure is a percent of the 49 firms that answered this question
As Figure 12 shows, there is quite a wide variation in scenario analysis coverage: nearly 40% cover more than three quarters of their business (however defined), whereas a further 38% cover less than half. This disparity may be driven by the factors shown in Figure 11; nonetheless, it does indicate that not all climate risk scenario analysis exercises provide very comprehensive coverage.
Conclusions

This chapter presents an update of GARP’s deep dive on climate scenario analysis published in last year’s CFRF Scenario Analysis Implementation Guide. It draws on insights from firms that participated in GARP’s Fourth Annual Climate Risk Management Survey.
This year’s deep dive shows the rising influence of the regulator – from the growing use of NGFS scenarios, to increasing participation of firms in regulatory exercises, to the scope of portfolio coverage. Increased regulatory scrutiny has no doubt accelerated firms’ efforts in climate scenario analysis, which is to be applauded. The fact that supervisors and central banks are actively engaged to learn from one another (through the NGFS) is also very positive.
That said, climate change is the ultimate global risk management challenge. It’s therefore important to ensure that we get a healthy balance between regulatory and firms’ own climate scenario analysis exercises in the coming years. Given the degree of uncertainty associated with different climate outcomes, it is also particularly important for firms to use a variety of scenarios to ensure they understand the full range of possible impacts.
Annex: A Primer on Key Scenario Providers

Network for Greening the Financial System (NGFS)
The NGFS is a coalition of central banks and supervisors that has developed various scenarios, broadly split into two categories:
- “Orderly” or “disorderly” transitions to either 1.5oC or 2oC warming.
- Hot-house world scenarios of little policy action and high physical risks.
International Energy Agency (IEA)
The IEA produce a range of scenarios, including:
- The Net Zero Emissions by 2050 Scenario (NZE), which “achieves an emissions trajectory consistent with limiting global temperatures to 1.5 °C without a temperature overshoot (with a 50% probability), universal access to modern energy services and major improvements in air quality.”
- Two scenarios – the Announced Pledges Scenario (APS) and the Stated Policies Scenario (STEPS) – that define a “set of starting conditions, such as policies and targets, and then sees where they lead based on model representations of energy systems, including market dynamics and technological progress.”
- A Sustainable Development Scenario (SDS) that “maps out a pathway consistent with the ‘well below 2 °C’ goal of the Paris Agreement, while achieving universal access and improving air quality.”
In each of the above scenarios, the IEA assumed that the pandemic would be largely brought under control by the end of 2021 in advanced economies and in China, but that reining in the pandemic would take longer in many emerging market and developing economies. For more details, see: Understanding WEO scenarios.
Intergovernmental Panel on Climate Change (IPCC)
Representative Concentration Pathways (RCPs) are a series of scenarios used by the IPCC, based on different projections of atmospheric concentrations of greenhouse gases and other air pollutants and land use by the year 2100. Four RCPs were published in the Fifth Assessment report: RCP2.6, RCP4.5, RCP6.0, and RCP8.5. Each RCP corresponds to a different level of total atmospheric “radiative forcing” (a direct measurement of the greenhouse effect), meaning that they each produce different degrees of future global temperature increase.
By 2100, relative to a 1850-1900 baseline, the IPCC forecasts the following:
- The most stringent mitigation scenario will be RCP2.6, with a median temperature increase of 1.6o
- RCP 4.5 and RCP6.0 will be the intermediate scenarios.
- The highest emissions scenario, RCP8.5, will yield a median temperature increase of 4.3oC
Shared Socioeconomic Pathways (SSPs) are a series of scenarios synthesized by the IPCC, which outline different states of socio-economic prosperity and resilience by the year 2100, based on different possible trajectories of development. Five SSPs were published in the Fifth Assessment report: SSP1 through SSP5, which reflect five different sets of socio-economic assumptions.
A new set of five SSPs were published in the Sixth Assessment Report: SSP1-1.9, SSP1-2.6, SSP2-4.5, SSP3-7.0 and SSP5-8.5. These five new SSPs (SSPx-y) included indicative levels of radiative forcing alongside their socio-economic assumptions. The first number (x) in the label corresponds to the particular set of socio-economic assumptions, and the second number (y) is the level of atmospheric radiative forcing reached in 2100. The following are outlined in the IPCC’s Sixth Assessment report:
- SSP1-1.9: Warming is held to around 1.5C above 1850-1900 in 2100, with “slight overshoot”; net-zero CO2 emissions around 2050.
- SSP1-2.6: Warming remains below 2C; net-zero emissions in the second half of the century.
- SSP2-4.5: A scenario that “deviates mildly from a ‘no-additional climate-policy’ reference scenario, resulting in a best-estimate warming around 2.7C by the end of the 21st century.”
- SSP3-7.0: A medium-to-high reference scenario resulting from no additional climate policy, with “particularly high non-CO2 emissions, including high aerosols emissions.”
- SSP5-8.5: A high emissions reference scenario with no additional climate policy.
For more information, see Annex 2 of the CFRF’s 2020 Scenario Analysis Chapter, and the GARP jargon buster.
_____________________________________
This chapter represents the output from the Scenario Analysis Working Group, part of the Climate Financial Risk Forum (CFRF).
This CFRF guide has been written by industry, for industry. The recommendations in this guide do not constitute financial or other professional advice and should not be relied upon as such. The PRA and FCA have convened and facilitated CFRF discussions but do not accept liability for the views expressed in this guide which do not necessarily represent the view of the regulators and in any case do not constitute regulatory guidance.
Copyright 2022 The Climate Financial Risk Forum
Topics: Physical Risk, Transition Risk, Climate Risk Management