
Record numbers of hurricanes and wildfires are unlikely to prompt significant changes in models gauging the probability of resulting losses, but tools accompanying recent catastrophe model updates should enable the structuring of transactions to reflect the increased risks.
The widely used models of AIR Worldwide and Risk Management Solutions (RMS) tend to evolve incrementally, officials of those firms explained, even as extreme events proliferate.
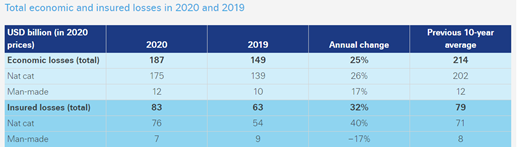
According to preliminary estimates by Swiss Re Institute, insurance industry losses in 2020 of $76 billion from natural catastrophes and $7 billion from man-made disasters added up to the fifth-highest global total on record. At the same time, total economic losses of $187 billion were $27 billion below the 10-year average.
AIR Worldwide, however, provided updates last summer to models that Jaesung Park, head of research at Nephila Capital, a large manager of insurance-linked securities, said address “climate-sensitive perils.”
Park, the firm's head of research, added that incidences of wildfires in the U.S. West and severe Atlantic hurricanes suggest the risk was not being priced correctly.
To adjust its hurricane model that accounted for wind and storm surge, AIR Worldwide incorporated a module for precipitation-induced flood risk. It now provides a comprehensive view of all sources of hurricane loss as well as flood risk when combined with the AIR Inland Flood Model for the U.S.
Hurricanes and Floods
Precipitation-induced flooding still plays a relatively small role in hurricane-related losses. Adil Imani, manager on AIR Worldwide's insurance-linked securities (ILS) and catastrophe (cat) bond team, said that in the firm's hurricane model, precipitation flooding currently makes up only 3.5% of the average annual losses. However, such precipitation has been a growing factor since 2017; Hurricanes Harvey (2017) and Florence (2018) caused severe flooding, with nearly 90% of Harvey's losses coming from precipitation.
States located away from the coasts and regions such as the Northeast with lower hurricane frequency “are impacted much more by the inclusion of hurricane precipitation, as are select states like Texas,” Imani said.
Park noted that the inland flood module has not yet been widely used for specific pricing and risk assessment, so the updated hurricane model will require time to validate. But, with climate change seen as a bigger factor, he said, “I think this is going in the right direction.”
Swiss Re Institute said, “Climate change is expected to exacerbate secondary peril events as more humid air and rising temperatures create more extreme weather conditions. These favor the onset and spread of events such as wildfires, storm surges and floods.”
Enhancing Models
Adrian Mark, head of non-life analytics at Leadenhall Capital Partners, noted that other model vendors have provided views on flood risk, but the key distinction is whether they fall within their hurricane or flood models.
“The benefit of the former is that all sources of loss from a hurricane - wind, surge, precipitation induced flood - are included in the same model estimate, with associated policy conditions applied to that consolidated loss,” said Mark, a senior manager of model solutions at RMS before joining Leadenhall in 2017.
Imani said AIR Worldwide is “very comfortable” with its wildfire model, revamped in 2018 to include additional states and better reflect how fire spreads. The enhancements last year gave insurers, reinsurers and ILS investors a better view of territorial relativities - how the policies differ among properties in proximity to one another and across the entire model domain - to provide a more complete view of risk.
For one, the update dramatically increases the number of the model's simulated wildfire “events,” to 6.5 million from 700,000, in its 10,000-year catalogue. The increase improves insurers' analysis of the frequency and paths of fires, enabling them to inform policyholders better about mitigation and evacuation measures.

The wildfire model now also offers a 100,000-year catalogue, which can provide more confidence in the likelihood that an event will occur, increasing the model's credibility and investors' comfort in it.
Updates of the hurricane and wildfire models aim to give insurers and ILS investors a better understanding of the covered risks, increasingly relevant with a view toward climate change.
“The models themselves are not climate-change focused, but they are improving the model of perils that are sensitive to climate change,” Park said. It is uncertain whether and when AIR Worldwide will incorporate climate change adjustments directly into its models, but until then, “that won't stop many investors from making those adjustments on their own,” he added.
Residential Versus Commercial
Pascal Karsenti, Nephila's director of research and technology, said AIR Worldwide's updates are valuable but not “earth-shattering,” as the firm had already included non-hurricane rainfall in its U.S. inland flood model, and hurricane-driven flooding in other geographies. In addition, most residential flood insurance falls under the federal National Flood Insurance Program, so the flood update's impact for private insurers is limited to commercial properties.
Wildfire is insured entirely by the private markets, but the bigger event catalogue primarily expands the model's footprint into remote areas.
“The changes are meaningful if you happen to be exposed to those corners of the market,” Karsenti said.
The expanded wildfire catalogue now includes events whether or not they may result in an insured loss, giving insurers a better view of the localized frequency of fires and ability to analyze and differentiate between risks, Imani said. That can provide probabilities of how fires may spread, their eventual burn scars, resulting loss levels and insurers' exposed limits in a given radius.
“All of these can inform the guidance they give their policyholders in terms of evacuation and mitigation, help them prepare claims adjusters to deploy to this region, mobilize support functions, contact their business partners, etc.,” Imani said.
Clarity for Investors
The benefits are less direct for ILS investors, since their exposure is at the top of the insurance-coverage stack and remote from the actual peril risk. And because they typically manage diversified portfolios to mitigate risk, they are less impacted by specific samplings of peril events. Nevertheless, the AIR Worldwide updates should enable them to better quantify their risks and reduce uncertainty.
“When looking at events like wildfires, which are fairly frequent occurrences, understanding the implied frequencies within our model by geography, size of fire, level of loss, etc., can help gain confidence in the model, and consequently in the modeling of catastrophe bonds using these models,” Imani said.
Sophisticated investors have always taken into account risks that may not be included in specific peril models, said Andrew Hickman, global head of risk modeling and data science at Marsh Advisory. Any missing risks would typically be thoroughly disclosed in something as legally rigorous as a Rule 144A ILS offering, he said, adding that incorporating precipitation-induced inland flooding now provides a more complete and reliable measure of Atlantic hurricane risk.
“Now the investor can say, 'Do I think that's the right amount or not?'” Hickman said. “That's a question with a lot less uncertainty around it than not having that modeling in there, where you have to just take your best guess.”
“Less Modeling Uncertainty”
In a similar vein, the new 100,000-year wildfire event catalogue enables investors to better understand their risks.
“It certainly gives more precision around the risk results,” Hickman said, noting that “increased granularity may be appropriate when analyzing higher layers [of risk] with low probability” of triggering coverage.
In a 10,000-year catalogue, for example, a 1-in-1,000 probability that a bond's coverage will be written down to zero due to a wildfire event would be based on just 10 events, but in a 100,000-year catalogue that goes up to 100 events.
This should be more reassuring to investors because “it takes some of the discreteness out of the extreme tail,” Hickman said. “There's less modeling uncertainty around the risk results.”
Cat Bond Structures
The bigger event catalogue, although still covering relatively few properties in the context of the western U.S., may nevertheless enable some new cat bond structures, Karsenti said. He noted that AIR Worldwide's previous model focused on heavily populated areas, thereby underestimating the size of burn footprints.
“So with the new model and a more complete footprint, you should be able to come up with a much better estimate of a transaction that would be triggered based on total burn area,” Karsenti said.