
The sudden collapse of Silicon Valley Bank (SVB), the second largest bank failure in U.S. history, has been subject to an avalanche of media scrutiny. But there is one key question that has yet to be sufficiently addressed: How did SVB stack up against other U.S. banks with similar levels of total assets, from a systemic risk perspective?
A review of publicly available systemic risk indicator data disclosed by SVB's parent, SVB Financial Group (SVB FG), yields some very interesting insights into how SVB compared to banks of similar size on the basis of on- and off-balance sheet exposures, intra-financial system exposures, cross-border activity, complexity and short-term funding levels.
Before diving into this comparison, we must first understand how the Federal Reserve classifies U.S. banks. In October 2019, the Fed published a set of quantitative rules intended to tailor regulations for the largest U.S. banks to more closely match their risk profiles. Known as the Tailoring Rule, each bank is assigned to one of five buckets based upon its risk profile. The U.S. global systemically important banks (G-SIBs) are assigned to Category I; at the time it collapsed, SVB was assigned to Category IV.
Figure 1 depicts the component breakdown of each Category IV bank’s systemic risk profile, called a SiFi score, by systemic risk indicator. In short, it shows that SVB FG’s systemic risk profile was significantly higher than that of the other U.S. banks in its asset-size class.
Figure 1: Breakdown of Category IV Banks by Systemic Risk Indicator (2019-2022)
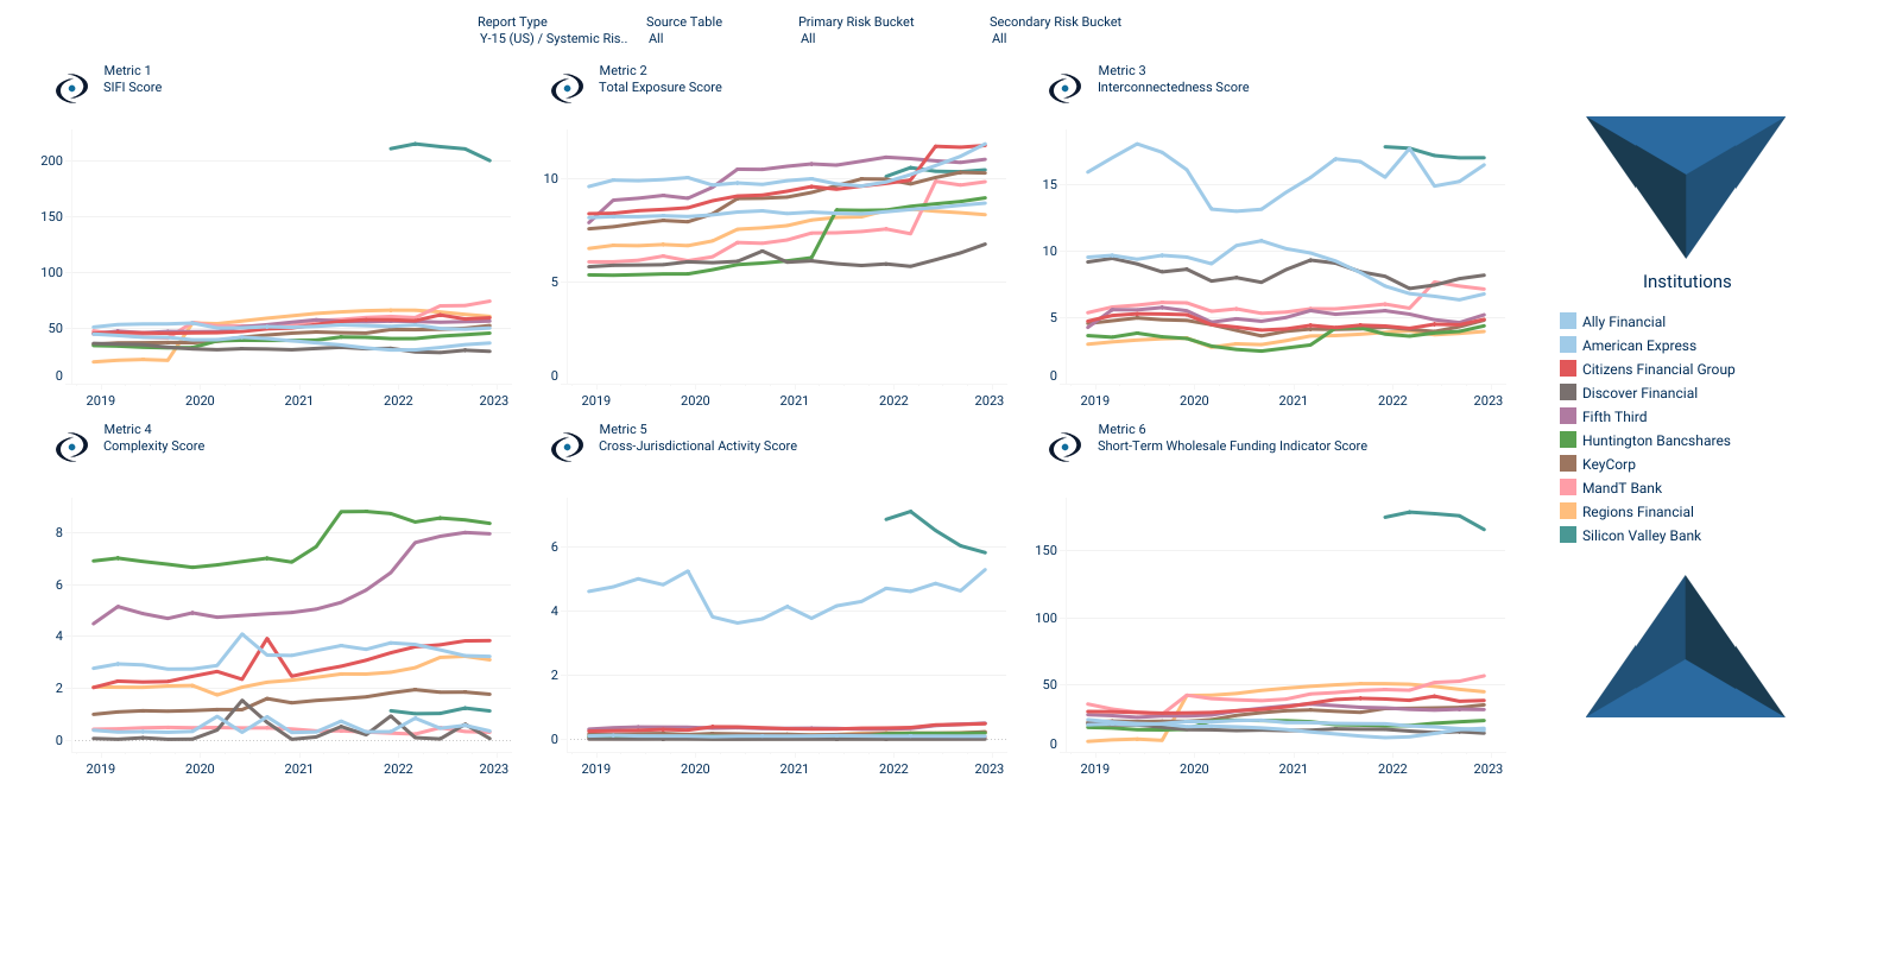
Source: GARP Pillar 3+ platform
The drivers causing SVB FG’s SiFi score to be so much higher than the rest of the pack are the level of interconnectedness with the rest of the financial sector, cross-border activity and, in particular, short-term wholesale funding.
A bank’s short-term wholesale funding indicator score is a function of its ratio of total short-term wholesale funding to its average risk-weighted assets. This ratio is known as the short-term wholesale funding metric.
Figure 2: Breakdown of Category IV Banks by Short-Term Wholesale Funding Indicator (2019-2022)
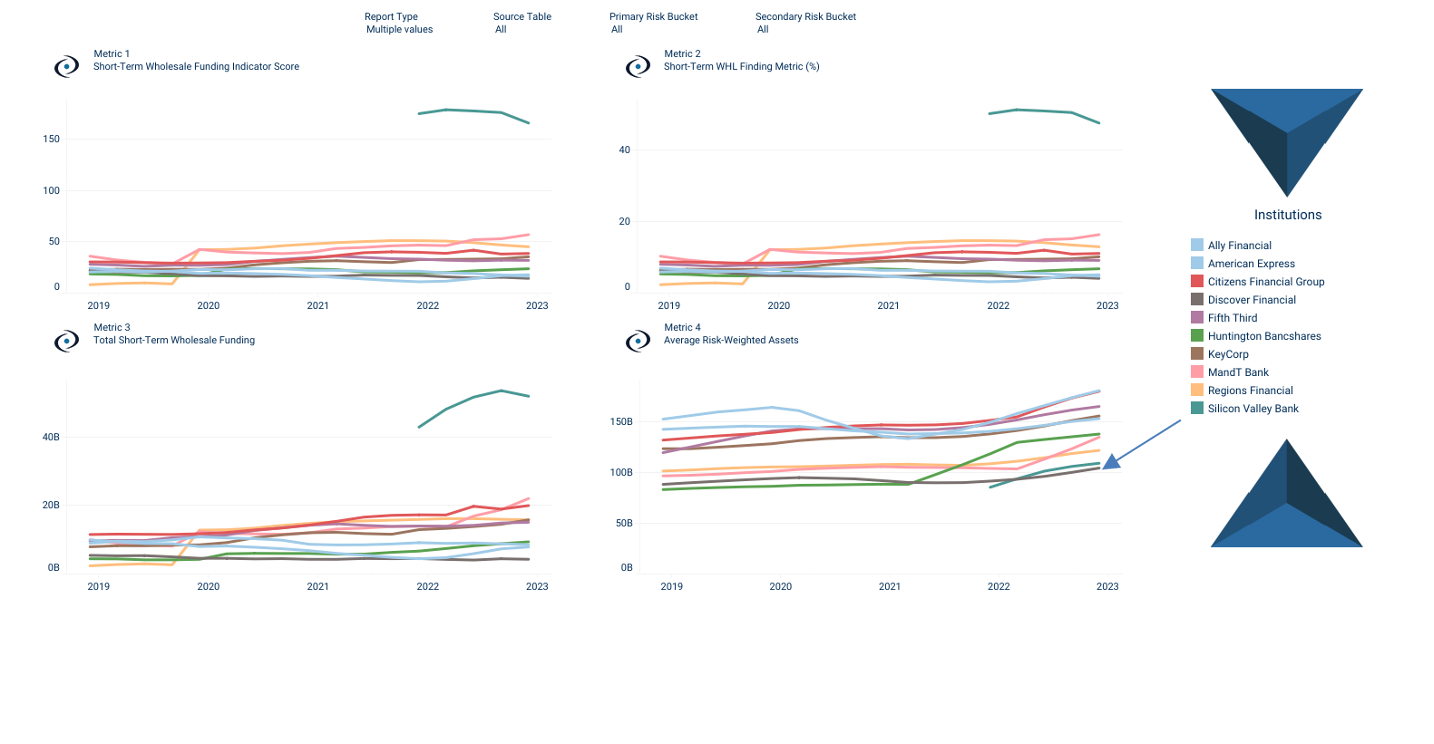 Source: GARP Pillar 3+ platform
As depicted in Figure 2, SVB FG’s average risk-weighted assets were approximately 75% of the group average, but its level of short-term wholesale funding was multiples of the rest of the Category IV banks.
To better understand the SiFi score and how SVB arrived at this stage, let’s take a look at the regulators’ measurement of systemic risk, both in the U.S. and abroad.
Getting to Know SVB: More Systemic Risk Insights
SVB FG, as we’ve mentioned, was categorized as a Category IV U.S. bank holding company under the Federal Reserve’s Tailoring Rule. This rule operates on just a few indicators of systemic risk. For example, the Category IV designation is determined solely on the basis of total consolidated assets, with lower and upper bounds of $100 billion and $250 billion, respectively.
According to group 10-K reports, SVB FG's total assets grew from $71 billion at year-end 2019 to $116 billion at year-end 2020. The Federal Reserve moved SVB FG into the Category IV bucket only in 2021, by which time its group total assets had grown even further, to $212 billion at year-end.
Disclosure of a much broader set of systemic risk indicators is required, in accordance with the Fed’s FR Y-15 reporting template, for every U.S. bank holding company categorized as either a G-SIB or a Category II, III or IV bank.
Regulatory bodies outside the U.S. have similar disclosure requirements for the largest banks operating in their own jurisdictions. At the global level, the Basel Committee on Banking Supervision and the Financial Stability Board use these disclosure reports from approximately 76 banks to create SiFi scores and publish their list of G-SIBs – bucketed by a capital surcharge – each November.
The Federal Reserve reviews the same disclosure reports for the 40 banks in the U.S. categorized as either G-SIB, Category II, Category III or Category IV. Sixteen of these banks are foreign banks with substantial footprints in the U.S.
The capital surcharge imposed by the Federal Reserve on the G-SIBs is also calculated based upon a SiFi score, but its derived from a methodology (commonly known as Method II) that differs slightly from that used at the global level. This methodology nevertheless uses the previously-mentioned systemic risk indicators: on- and off-balance sheet exposures, intra-financial system exposures, cross-border activity, complexity and short-term funding levels.
So, we can calculate a SiFi score for every G-SIB, Category II, III, and IV bank, benchmarking each on the same basis. Figure 3 provides a snapshot view of SVB FG's SiFi score alongside those for Northern Trust (Category II) and the rest of the Category IV U.S. banks.
Figure 3: Listing of Bank Systemic Risk Scores (2021-2022)

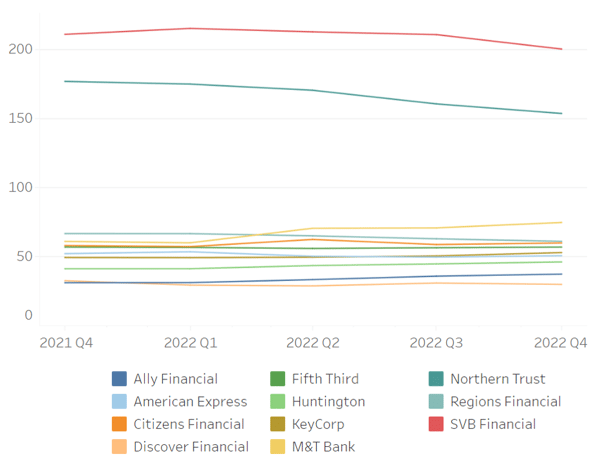
Source: GARP Pillar 3+ platform
Parting Thoughts
The collapse of SVB, and the subsequent shutdown of Signature Bank, have raised many of the same systemic risk alarm bells we have heard in the past. There will be more news about the impact of these failures in the days and weeks ahead. More importantly, there will be more systemic events like these in the future.
To be better prepared for future crises and to make more proactive, well-informed decisions, risk management professionals will need to use tools that give them a stronger grasp of both the systemic risk profiles of banks and the rules imposed by their regulators.
Chris Donohue (PhD), Managing Director, is the head of the GARP Benchmarking Initiative (GBI). He can be reached at chris.donohue@garp.com.
Bryan Feierstein, Senior Vice President, is a GBI study analyst and subject matter lead for GBI’s Pillar 3+ content. He can be reached at bryan.feierstein@garp.com.
Eli Crane, Vice President, is a GBI project manager and technology lead for GBI’s study platform and the Pillar 3+ site. He can be reached at eli.crane@garp.com.
GBI conducts independent, non-partisan surveys on a range of risk management topics, using data from more than 120 global financial services firms, including 26 G-SIBs. The analysis in this article was done using the GBI Pillar 3+ Platform – a repository of regulatory capital disclosure data; the parameters that drive the Tailoring Rule bucketing, the SiFi scores and their corresponding component breakdown were programmed into Pillar 3+ and refreshed automatically, each quarter, upon the release of each bank’s FR Y-15 report.
Topics: Financial Markets