
Today, if you are a tech-savvy financial institution, you need to assess the risks and opportunities of artificial intelligence – and of large language models (LLMs) like ChatGPT in particular.
Can LLMs yield greater insights and improved productivity? To find out, I performed quantitative risk analyses for the Australian Commonwealth government bond series. I used publicly available data and ran ChatGPT4 – the latest version of OpenAI’s generative AI technology – on my personal Mac.
Mike van de Graaf
The idea was to see how ChatGPT4 would identify clusters of yield curves via an unsupervised machine-learning approach. Would the language interface of ChatGPT4 help isolate outlier curves from the data set? How would it compare with the traditional approach of coding a program and generating solutions manually? And which methodology would prove more efficient, overall?
The Application: ChatGPT4 and Machine Learning
As a first step, ChatGPT4 was asked to collect the data from the Reserve Bank of Australia’s website in a file for me. Interestingly, ChatGPT4 created a file with simulated rates. It noted that the reason for this replacement was because “it could not get access to the RBA website.”
Consequently, I had to download the rates manually. From here, though, things picked up speed very fast. After uploading the yield data file, I placed the following request with ChatGPT4:
[>] Please perform a cluster analysis of the 3- and 10-year day-on-day yield movements for 2023.
This request did not include an explanation of “yield,” and I did not tell the system how to construct day-on-day movements. My initial thought was that this might be perhaps too broadly phrased for ChatGPT4. But why not start there and see what happens?
After about 15 seconds “analyzing” my request, ChatGPT4 surprised me by providing instant data on clusters and outliers for three-year versus 10-year yield moves, spitting out the following chart:
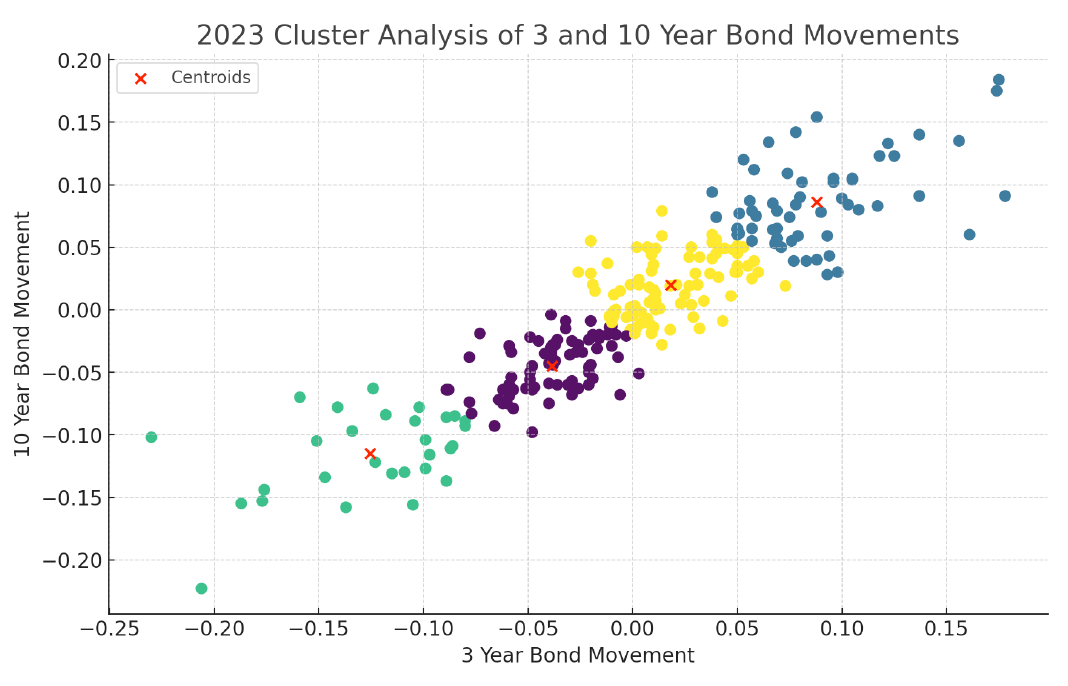
ChatGPT4 passed this hurdle without much trouble. I closely validated the output, and it was all correctly done. So, I now felt confident to submit this follow-up request:
[>] Please provide a cluster analysis of 2023 data for day-on-day yield movements and plot the resulting yield curve clusters in a graph.
After more analysis and a few agonizing moments, ChatGPT4 produced the goods, in the form of the following chart:
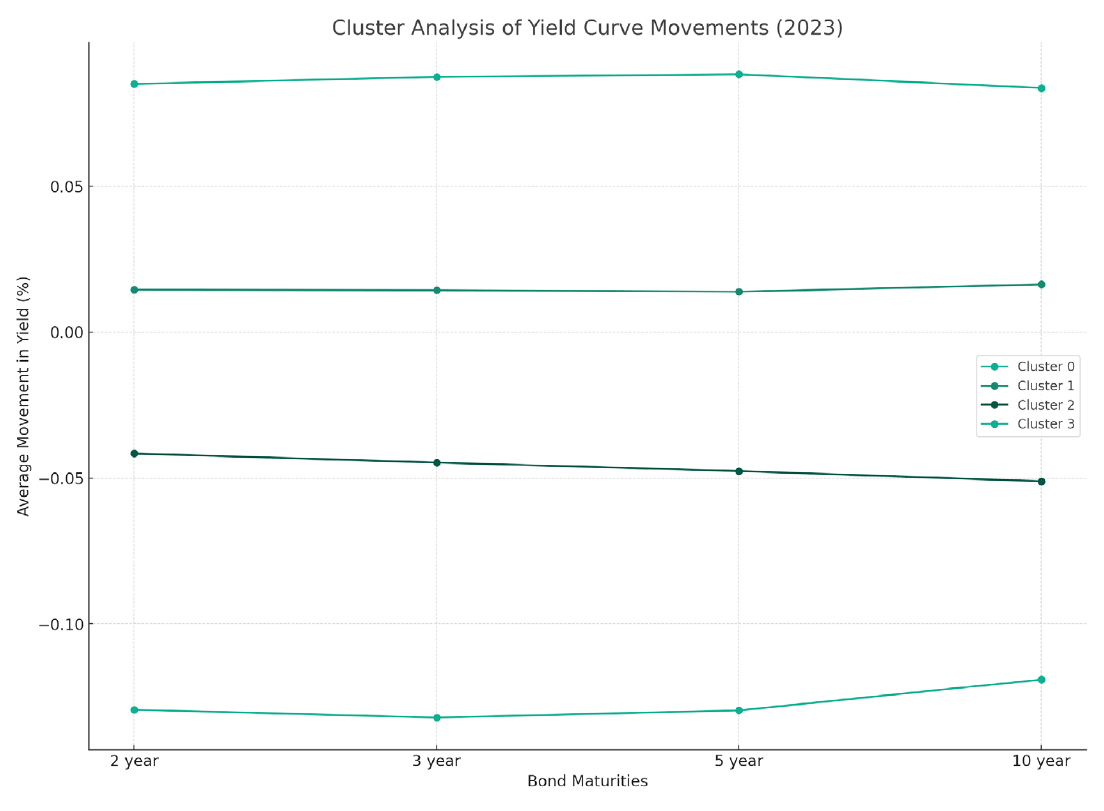
As we can see in the chart above, ChatGPT4 plotted the right patterns, as the common movements were expected to be “parallel” – i.e., to have broadly the same yield curve movement across the term. Comparing these against separate graphic representations I had created, I validated the output. (These clusters are representative of relevant risk measurement scenario analysis.)
Of course, we know that “risk lives in the tail,” so I was also interested in some of the daily shapes that are not parallel – the ones that appear with less probability. Examples include twists in the curve, where the movement between the short-end and the long-end vary. To find out more about tail risk, I submitted the following request to ChatGPT4:
[>] Please graph the day-on-day yield curve that had the greatest difference between two- and 10-year and crossed zero.
After analyzing my question, ChatGPT4 produced a chart that depicted the greatest difference, but it had both the two- and 10-year points being negative. It did not twist around zero, so that was wrong. Moreover, it only plotted the two- and 10-year points. I prompt-engineered my question to address these issues, and ChatGPT4 replied with the following chart:
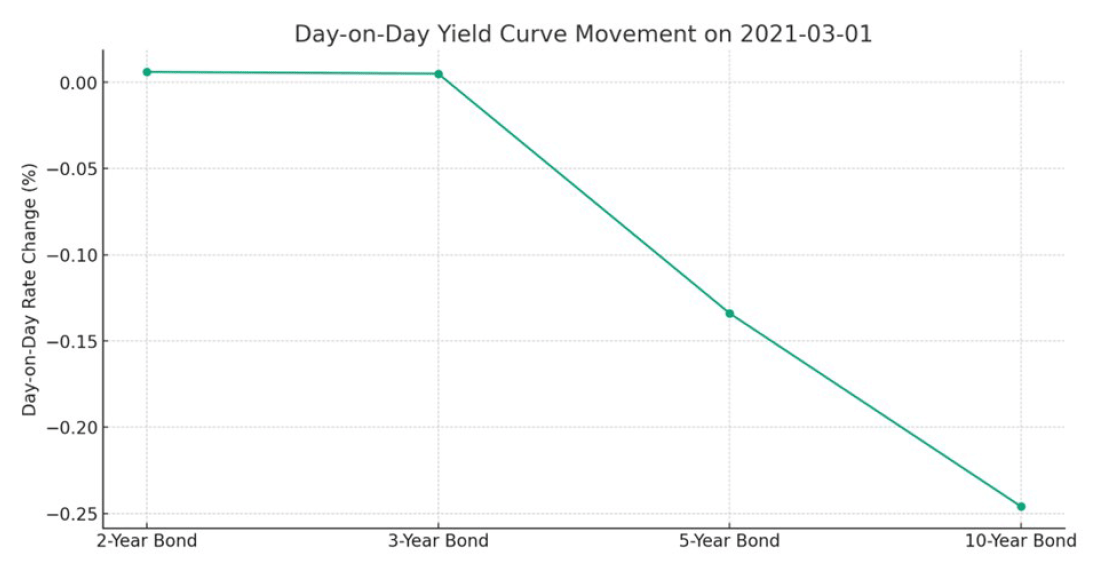
This time the system’s analysis was correct. ChatGPT4’s “severe but plausible” twist scenario over the period 2020-2023 could be used for any kind of relevant analysis. Of course, similar scenarios can be prompted from the data to build your curves over different economic and interest rate cycles.
Python and SciKit: The Benchmark
As a benchmark for this comparison exercise, I used the Python 3.12 for Mac programming language. To get quick access to solving some of the data structure routines in Python, and to set up my coding environment, I received an assist from ChatGPT 3.5. These things are covered in Python handbooks, but handbooks are very last decade!
This enabled me to employ the Open Source libraries to speed up various tasks, like reading input data files and converting file formats. I also used the SciKit library that has a stack of machine-learning models, including the unsupervised ML models that I needed to perform clustering of yield curves, via the Kmeans algorithm.
In roughly six hours from start to finish, I was able to produce a cluster analysis on data, a display with charts and centroids, and an array with results in Python. The sense of coding excitement I felt was a blast from the past.
Parting Thoughts
Getting back to the original point of this exercise, which approach was more effective? ChatGPT4 performed the 6-hour Python work in a conversation that lasted precisely five minutes. That’s a factor 72 productivity improvement!
Clearly, I did need to get up to speed again on programming, but with ChatGPT4 there was no need to code anything at all. ChatGPT4 produced the code to review and to copy just in case I wanted to use it in the future.
Any conclusion regarding AI must be preceded with the “at this stage” caveat. LLMs, as we’ve seen, can already generate significant productivity improvements in the model prototyping phase. But computation and data sets used by big tech to build and train the largest AI models are also improving at exponential rates.
To get the most out of LLMs, a combination of skills is required. Collaboration between data scientists and experienced and qualified risk managers (such as FRMs) could lead to great gains.
LLMs still need to be prompted with the right solutions and must be tested for limitations. Generative AI model outcomes must also be validated by humans. In other words, it remains essential to provided appropriate governance over the development and implementation of AI-augmented risk solutions.
Clearly, though, the future is already here with generative AI – and its benefits are evident. While some may still be wary of the risks of this advanced technology, progressive financial institutions will at least experiment with it, understanding that human intelligence is still very much required to aid AI decision-making.
Mike van de Graaf is the co-director of GARP’s Australia chapter. He is also Executive Director, Risk, at the Treasury Corporation of Victoria (TCV). The opinions expressed in this article are solely those of the author and do not represent the views of TCV.
Topics: Tools & Techniques