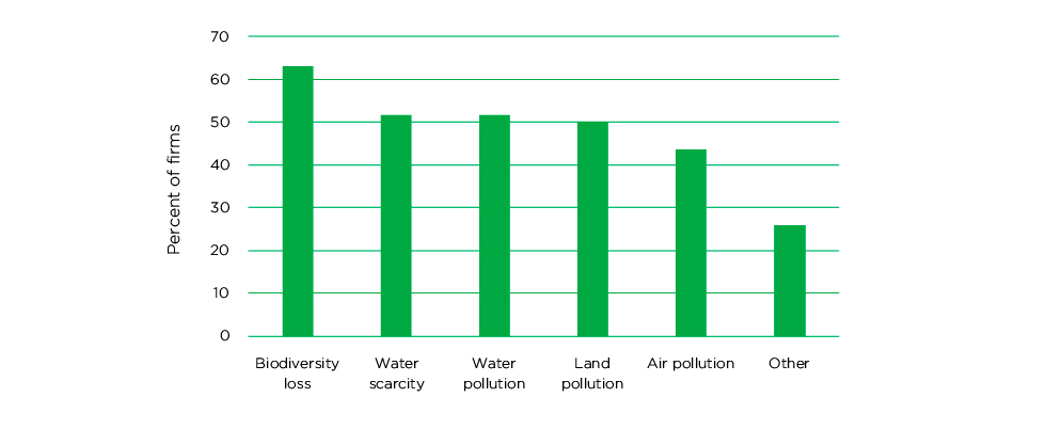
Biodiversity loss is an area of financial risk that an increasing number of financial institutions are looking at, according to GARP’s Fourth Annual Survey of Climate Risk Management. Of the 76% of firms that look at one or more environmental risks beyond climate change, 63% examine biodiversity loss (Figure 1).
Figure 1: Environmental Risks Considered Beyond Climate
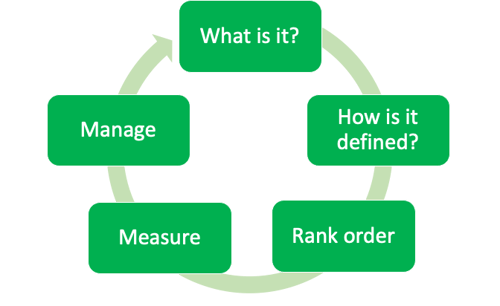
It’s consequently becoming increasingly important to understand both the ramifications of biodiversity loss for a firm’s portfolios and the impact of its financial activities on biodiversity. GARP recently wrote the paper Biodiversity Loss: An Introduction for Risk Professionals to help risk professionals identify the risks associated with biodiversity. The next steps fare to define the risks, rank them (from least to most risky) and measure them.
Figure 2: The Financial Risk Cycle: Identification, Measurement and Management
A variety of measures can be used to understand biodiversity loss and its potential impacts on a financial firm’s balance sheet. Some of them assess the impact of one species, or the effects of one driver of biodiversity loss, and others incorporate a range of impacts. As this is a relatively new area, there isn’t yet a consensus on which measure(s) to use, so risk managers should be aware of the different types of measures and the developments to watch.
Measures for One Species or Driver of Biodiversity Loss
One way of measuring biodiversity loss is to focus on one species (e.g., bees) or one driver of biodiversity loss (e.g., deforestation). A target for biodiversity can be set at the level of a portfolio or for the balance sheet as a whole. For example, a firm might commit to achieve no net loss of biodiversity through its lending and investments. Biodiversity loss would then be measured for each company it lends to or invests in; these assessments can then be aggregated to portfolio level and the portfolio level assessments compared to the aggregate target.
One example of firms assessing the impact of a portfolio on biodiversity loss is financial institutions that are working to eliminate commodity-driven deforestation (such as the destruction of tropical forests for soy or beef production). Those institutions which are part of the Finance Sector Deforestation Action committed “to use best efforts to eliminate forest-risk agricultural commodity-driven deforestation activities at the companies in our investment portfolios and our financing activities by 2025.”
To understand how much their activities affect deforestation, they could measure how much they lend to, invest in or underwrite activities for companies that are exposed to deforestation. Alternatively, if this measure isn’t available, a simpler measure is to look at the proportion of their clients/counterparties that are exposed to deforestation. Aviva’s Biodiversity Report 2022 contains further measures that could be used against deforestation, such as the strength of deforestation management at companies that are exposed to it; tree-cover loss in sovereign holdings; and tree-cover loss in structured finance deal locations.
While most measures relate to biodiversity loss, some look at the potential to increase biodiversity. For example, the Species Threat Abatement and Restoration (STAR) metric quantifies how reducing threats in a particular place can reduce extinction risk. Companies can use it to understand how their activities or supply chains impact amphibians, birds and mammals. This information can be used to plan actions to reduce species extinction risk.
Turning to the other perspective — the impact of biodiversity loss on a portfolio — companies could state their income generated from nature-dependent resources, such as fish or crops, according to the guidance from the Climate Disclosure Standards Board. This will allow firms to understand how much of their revenue is at risk if biodiversity declines further. The income dependency can be divided into:
- supply (inputs needed from nature) — e.g., pollination, which is needed for three-quarters of the plants used for food;
- delivery (outputs/products from nature) — e.g., calorie content of fish caught; and
- contributions to wellbeing — e.g., number of jobs provided by agriculture.
Holistic Biodiversity Loss Measures
Holistic measures aim to calculate the overall biodiversity footprint of a financial institution’s portfolio. They therefore cover a range of different impacts on biodiversity.
In general, these models:
- Assess the impact that a company, investment or project has on a driver of biodiversity loss. The drivers are climate change, land/water/sea use change, resource exploitation, pollution and invasive species.
- Then calculate the relationship between the driver and biodiversity loss.
- Calculate the impact on biodiversity loss by combining (i) and (ii). This can then be converted into the impact on biodiversity per million invested.
For example, the Biodiversity Footprint for Financial Institutions (BFFI) is a tool for financial institutions to take the impact of biodiversity into account in their investment decisions and to determine the biodiversity impact of their loans and investments. It can also be used to calculate the effect of all the companies in a stock market index, as shown in Figure 3 for the MSCI Index.
Figure 3: Biodiversity Loss of the Companies in the MSCI Index
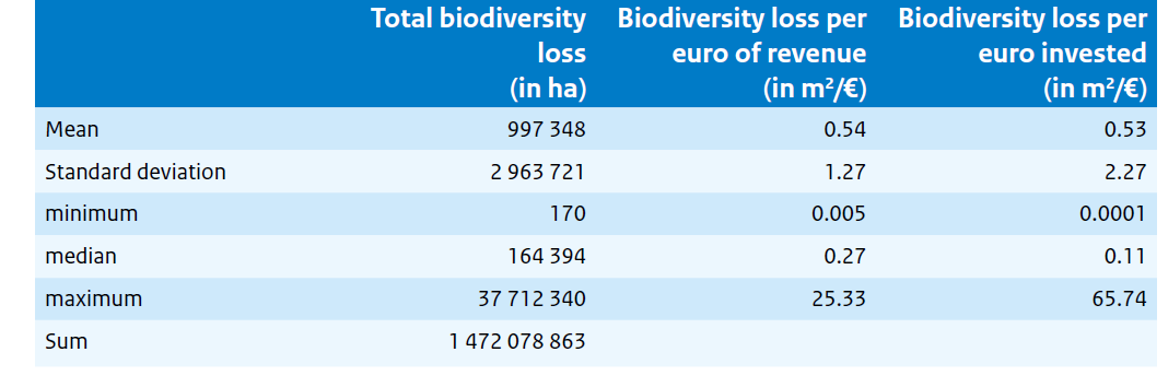
Source: Government of the Netherlands
Things to Watch Out for
Given the variety of plants, animals, fish and drivers of biodiversity loss that could be assessed, a firm will most likely need to use a few measures to gain a comprehensive picture of its portfolio’s impact on biodiversity and the impact of biodiversity loss on its portfolio. This is similar to the variety of measures that are needed to assess climate change impacts. The European Business and Biodiversity Platform is a useful place to start as it contains a summary of a number of measures and a “navigation wheel” to help identify which measure is most useful for different applications.
A limitation of many current models for measuring portfolio impacts is that they are more commonly developed for stocks/equity and bonds than loans or funds. Also, they are often developed using averages both for (i) characteristics such as sector revenue and biodiversity impact and (ii) the relationship between pressures on biodiversity and biodiversity loss. Consequently, the outputs of the models provide an indication of the relationship between the investment in a real-economy company and biodiversity loss as opposed to a concrete impact figure.
The evolution of measures is another area to be aware of; for example the Taskforce on Nature-related Financial Disclosures (TNFD) will be publishing a final risk management and disclosure framework in September 2023 and the IFRS Sustainability Disclosure Standards may be enhanced to cover natural ecosystems.
Like climate risk a few years ago, firms can’t wait for a “perfect” measure to be created and just need to get started understanding their portfolio’s impact on biodiversity and how biodiversity losses impact their business.
Maxine Nelson, Senior Vice President, GARP Risk Institute, currently focuses on climate risk management. In her career, she has held several senior roles where she was responsible for global capital planning and risk modelling at banks, including global head of wholesale risk analytics and head of capital planning at HSBC. She also previously worked at the UK Financial Services Authority, where she was responsible for significantly expanding counterparty credit risk management during the last financial crisis.
Topics: Physical Risk, Nature Risk Management