A half-century ago, I worked while in college for a man named Arthur Bryson, who was a pioneer in the field of optimal control. The project was to extract information from multiple navigation aids to give ship navigators the best possible estimate of their positions.
In those days, GPS was not the instant and accurate signal you get on your phone today but a much noisier system. Navigators also had input from star sightings, inertial-integration gyroscopic devices and “dead reckoning” calculations based on recorded speed and direction, combined with estimated currents.
Aaron Brown
The mathematical field for extracting optimal signals from multiple noisy measurements is called “filtering.” An important point is that we were less interested in the precise (best) estimate than in the plausible error.
A ship’s captain does not ask her navigator for the position to the nearest meter, but whether or not all plausible positions for the ship are safe. Being off by a few kilometers in the middle of an ocean doesn’t matter as much as being off by a hundred meters near shoals or rocks.
Filtering is a key tool in risk management, for similar reasons. Risk managers receive signals from different sources — including probabilities implied by market prices, estimates from line-risk decision makers, historical data and theory. Out of these often conflicting sources, they must construct a plausible region for true underlying values and determine if that includes zones of unacceptable dangers or excludes areas of attractive opportunities.
Lessons from Trump vs. Harris Forecasts
Risk managers must adjust for errors and biases when evaluating signals. As a topical example, let’s consider the upcoming U.S. presidential election. Obviously, from a financial risk management perspective, there are only two plausible outcomes — either Donald Trump or Kamala Harris will win. So, you must be prepared for either.
There may be a few financial institutions that have to consider lower-probability outcomes — like a 2000-style contested result, death of a candidate or civil unrest — but I’m not going to cover those things.
Assuming you’re not a superforecaster with access to inside information and a dedicated staff of researchers, you’ll likely rely on experts and prices from election betting markets. Most show Trump as a slight underdog in a close race for U.S. president.
However, it’s a mistake to take these numbers at face value. Rather, we must extract from them useful information and correcting some obvious flaws. Let’s now see what happens when we apply these techniques to a pair of U.S. presidential forecasting tools.
Before we move forward, one important point is that I’m not trying to make book on the election. There are many signals to consider, but I’m going to look at only two: the expectations of expert forecaster Nate Silver (founder of FiveThirtyEight.com and now posting forecasts and analysis on Substack) and a major election-betting site, PredictIt. I want to extract what information I can from these signals — that is, I want to know the message they convey — rather than form an opinion of the reliability of that message.
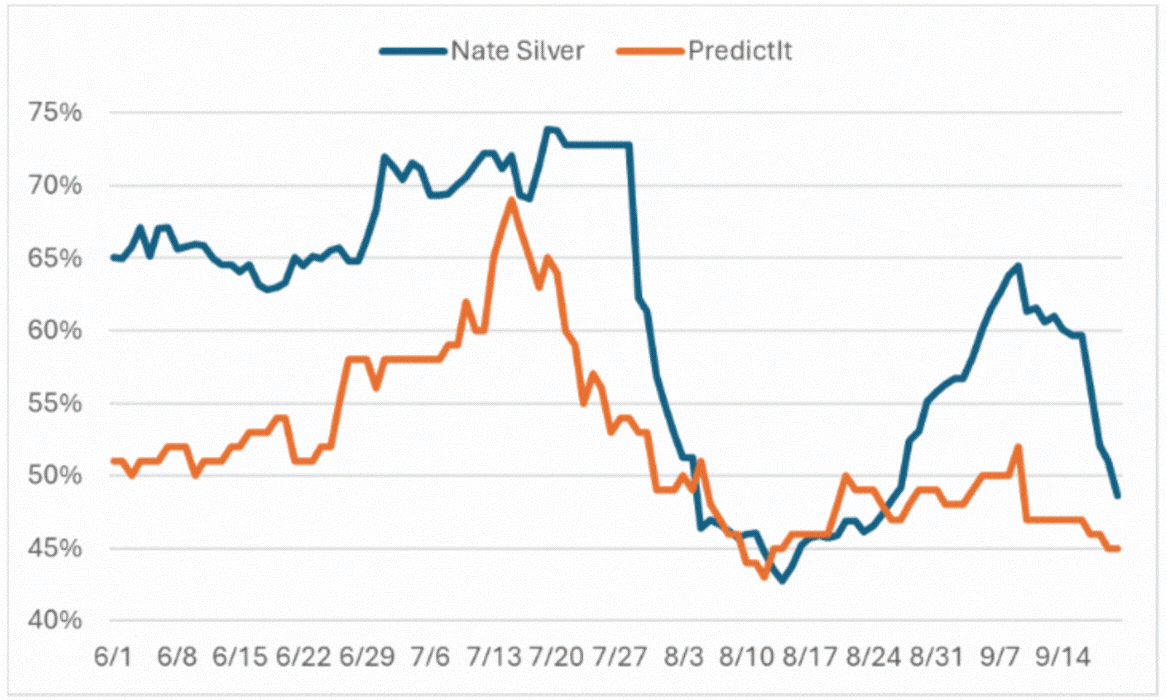
The chart below tracks the expectations of Silver and PredictIt for Trump. Although their estimates diverged substantially for most of the period since June, they were reasonably close in August and have come close again in late September to show Trump as a slight underdog.
Forecasts for U.S. Presidential Candidate Donald Trump

Source: PredictIt and Nate Silver’s Substack.
We should take the above numbers with a grain of salt. Forecasters and prediction markets have well-known systematic errors. It’s possible to adjust for these and combine the information from Silver’s modeling and the wisdom of crowds betting real money to get a superior estimate.
The Biases Dilemma
Most risk managers understand that forecasts can be significantly impacted by biases — flaws that must be accounted for when you are trying to weed out errors and evaluate accuracy.
This challenge is similar to a jury hearing testimony from two witnesses, each with known biases. You think both are basically truthful, but one is a friend of the defendant and will shade testimony to protect her friend. The other is at risk of being charged in related offenses and will shade testimony so he appears more innocent. Neither is entirely consistent, and the two conflict on some points.
You try to remove the biases from each witness’ testimony, then find the version of the truth most consistent with the two adjusted stories. This version could be radically different and is not necessarily the truth. It only represents your best judgment about what their evidence means for the case. Similarly, I’m not trying to consider all the evidence for election probabilities, only to interpret what Silver’s predictions and PredictIt’s prices tell us.
The first bias to consider is momentum. Both expert estimates and betting markets (which includes financial markets) have momentum in their forecasts (Silver) and prices (PredictIt). True probabilities are a “martingale,” that is a random walk without drift. If today’s probability is 60%, the expected probability tomorrow must also be 60%. That’s what probability means.
Betting markets have momentum because information leaks into markets only slowly; if there was, say, net good news yesterday, it’s more likely than not that some of that good news was not incorporated into yesterday’s prices and will push up prices today. As risk managers are aware, another reason for momentum is that many bettors (and financial traders) pile into bets that seem to be winning.
Experts build momentum into their forecasts for a different reason. Random walks — like a drunk staggering around randomly — are hard to explain. Half the time probabilities move in the opposite direction today as yesterday. An expert who says “Trump gains ground” today and “Trump loses ground” tomorrow will be treated as someone who can’t make up his mind and probably doesn’t know anything. And if he adds, “I have absolutely no idea what will happen tomorrow,” he will be written off completely.
As Nate Silver wrote, “People treat probabilistic predictions as deterministic ones — e.g., if Trump goes from a 48 percent chance of winning Wisconsin to a 52 percent chance, you’ll get a lot of ‘Nate Silver is calling Wisconsin for Trump,’ even though the forecast expresses a high degree of uncertainty and nothing in the model has really changed. And that’s on a good day. There are a lot of partisans — some acting in good faith and some not — who can become literally conspiratorial about the model.”
By holding back a little on good and bad news, experts can convert a drunkard’s walk into something that looks more like a sober guy going home. That’s an easy story to sell to people. Today’s move is usually in the same direction as yesterday’s, because the expert held back some of yesterday’s good or bad news to add to today’s news.
Incidentally, portfolio managers sometimes use the same trick. By valuing their portfolios using stale prices, they smooth out some ups and downs to make their track record seem to have less volatility. This reassures their investors and makes their gains look more like skill and less like luck.
By itself, momentum has the potential to drive prices to extremes. Betting and financial markets tend to offset this with longer-term mean reversion. In the case of PredictIt, its model moves every day 4% closer to a $0.45 price for Trump. This represents a medium-term value anchor for bettors. “Value anchor” is a behavioral finance term for a fixed or slowly changing reference point that exerts a pull on judgment, not allowing short-term information to move things too far away. You can think of it as a pool of bettors who are ignoring day-to-day news and polls, who come in to buy Trump if the contract gets below $0.45 and sell Trump if the contract gets above $0.45.
Momentum players and short-term bettors reacting to daily news drive prices up and down, but medium-term value bettors ignore the short-term news and pull the prices closer to their idea of fundamental value.
But Silver, like most experts, does the opposite. Every day he moves 3% away from his value anti-anchor of 41%. Experts who predict what everyone else expects get no respect. By exaggerating their differences, they get more attention and rewards.
While I won’t speculate about Silver’s motivations, most experts set value anti-anchors at a forecast that will do them no good — i.e., generate no headlines and result in little credit, whatever the outcome. Putting Trump at 41% is safe — if he loses, you had him at less than 50%; if he wins, you weren’t that much below 50%. It also wouldn’t cause many reporters to call. But Trump at 20% or 60% is news.
These moves, and the ones discussed below, may seem small. But since they are consistent every day, they can add up to significant impact on forecasts over weeks and months. Silver’s forecasts move 9% of the way toward PredictIt’s prices every day, and PredictIt prices move 3% of the way toward Silver’s. I don’t mean Silver is watching the PredictIt site and mechanically adjusting forecasts. He could be doing that, or using prediction market data in general, or looking at the same factors that drive bettor behavior.
PredictIt bettors could be reading Silver, or reacting to the same information that influences him. Whatever the mechanism, the two forecasts consistently move closer together.
PredictIt anticipates Silver’s momentum. Its prices move toward Silver’s forecasts, augmented by the average momentum. So, if Silver says Trump’s chances moved from 60% to 61%, PredictIt bettors seem to treat that as a move to 61.11%, since we expect Silver to add another 0.11% tomorrow if there is no news. (Silver actually adds 0.25% on average.)
Silver does the opposite, treating PredictIt’s momentum as overreaction to be subtracted. He subtracts 0.14 times PredictIt’s move from yesterday to today. So, if PredictIt goes from $0.60 to $0.61, Silver treats it as a rise to $0.6086.
This is further confirmation that PredictIt’s momentum is overstated, and knowledgeable observers like Silver subtract it before adjusting their forecasts toward the PredictIt value. Silver’s momentum, in contrast, is understated, and PredictIt bettors augment it before adjusting their bets.
Flawed Predictions: The Impact of Momentum and Mean Avoidance
Many people, including me, have griped about these flaws since 2016, when interest in presidential election forecasts took off — and accuracy took a nosedive.
It's always puzzled me why Silver, a top poker player and serious quant, would allow momentum and mean avoidance into his forecasts — especially in the face of widespread criticism. I just finished his new book, On the Edge (which I recommend highly), and it may hold the key.
To an extent that’s hard to understand, Silver is frustrated by uninformed criticism of his probabilistic forecasts. It reminds me of Cliff Asness, co-founder of AQR Capital Management, where I worked for 10 years. He was once railing about how crazy and irrational the market was, when his wife Laurel asked, “Don’t you make your money betting against crazy?”
You’d think Cliff and Silver would smile with quiet satisfaction at people misunderstanding probability — like hearing someone at a poker table saying, “I never fold if there’s any card in the deck that could make my hand.”
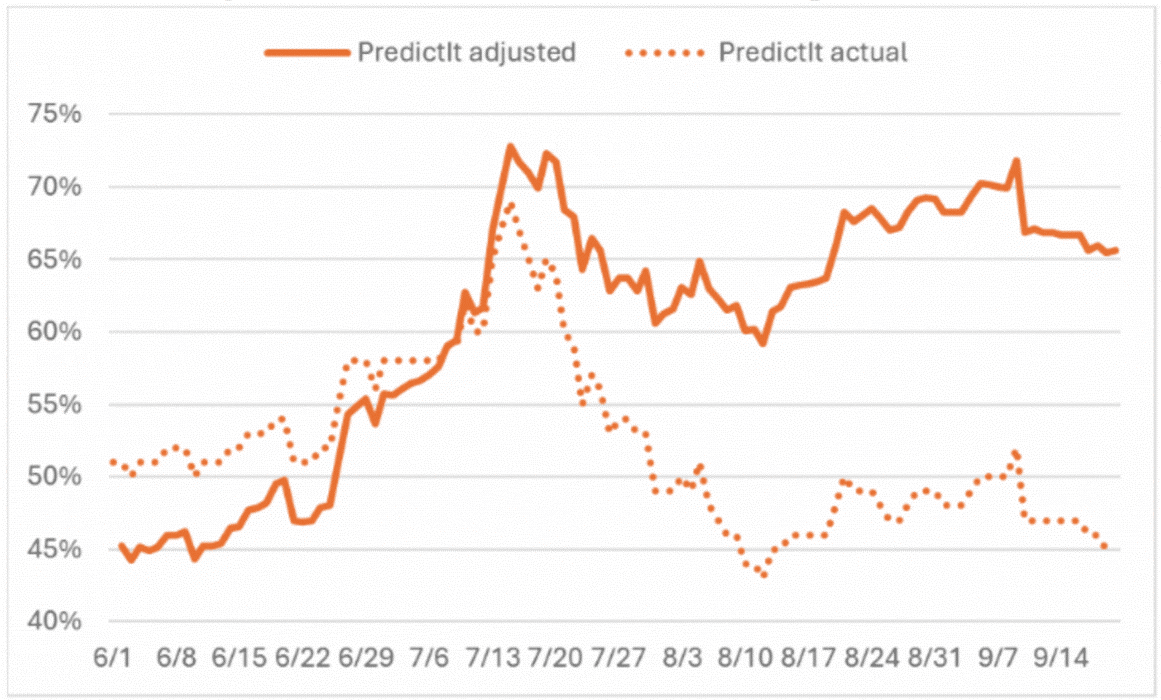
Anyway, what happens when we subtract the observed momentum and mean avoidance biases in the Silver and PredictIt U.S. presidential forecasts to get the pure information? The PredictIt price for Trump on June 1 was $0.06 higher than the value anchor of $0.45. From the beginning of June to mid-July, when Kamala Harris replaced Joe Biden on the ticket, the PredictIt prices did not capture the full extent of Trump’s gains, and it was held back by the value anchor.
Over the next month, dubbed “Kamalamania” in the press, the market prices greatly exaggerated Harris’ gains — which combined price momentum with the pull of the value anchor. Since mid-August, on the other hand, the value anchor has muted Trump’s gains. As a result, the price is stuck near the $0.45 value anchor, but the information in the price series suggests a much higher probability of Trump winning.
PredictIt: Adjusted vs. Actual Forecast for Trump

Source: Analysis of data from PredictIt.
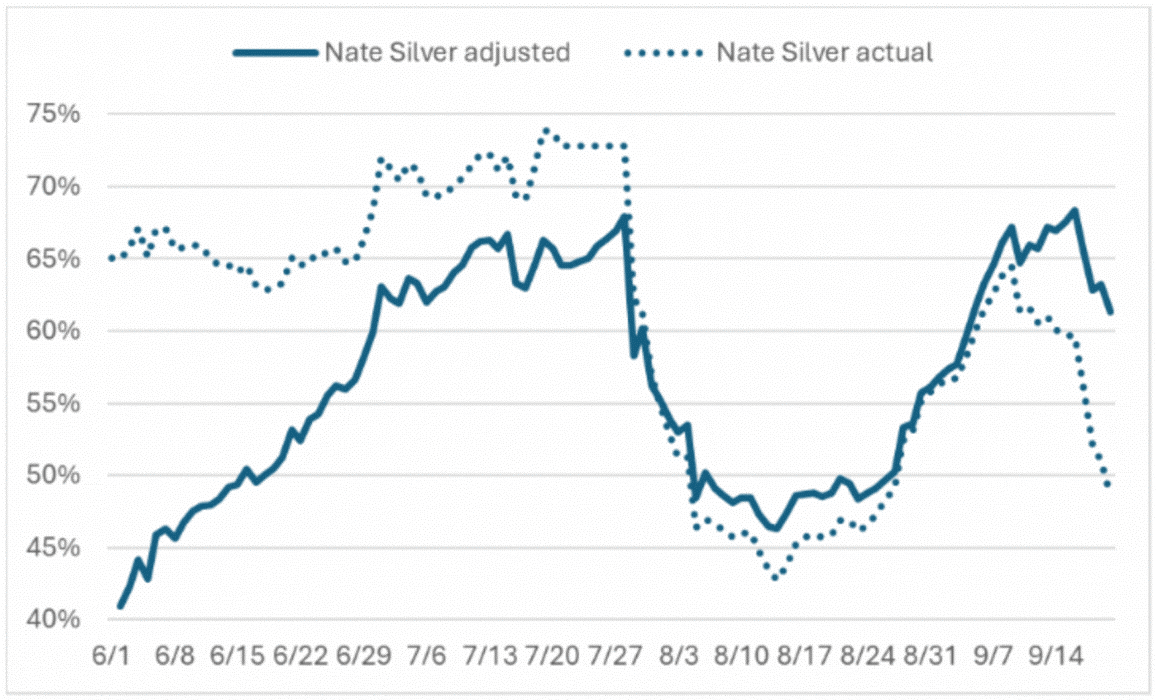
Nate Silver’s performance is quite different. He captured Kamalamania, both the Harris gains and losses, accurately. From June until the end of July, his published results show almost no news.
The only major event was a 6% gain for Trump after his debate with Biden. But the actual information in his forecasts started with Trump at a significant disadvantage, and then gaining rapidly until the end of July, two weeks after the media declared Kamalamania. In the last two weeks, the dynamics of his forecasts have taken Trump from a 64% favorite to a 49% slight underdog.
Nate Silver Forecast: Adjusted vs. Actual Odds for Trump

Source: Analysis of poll data from Nate Silver’s Substack.
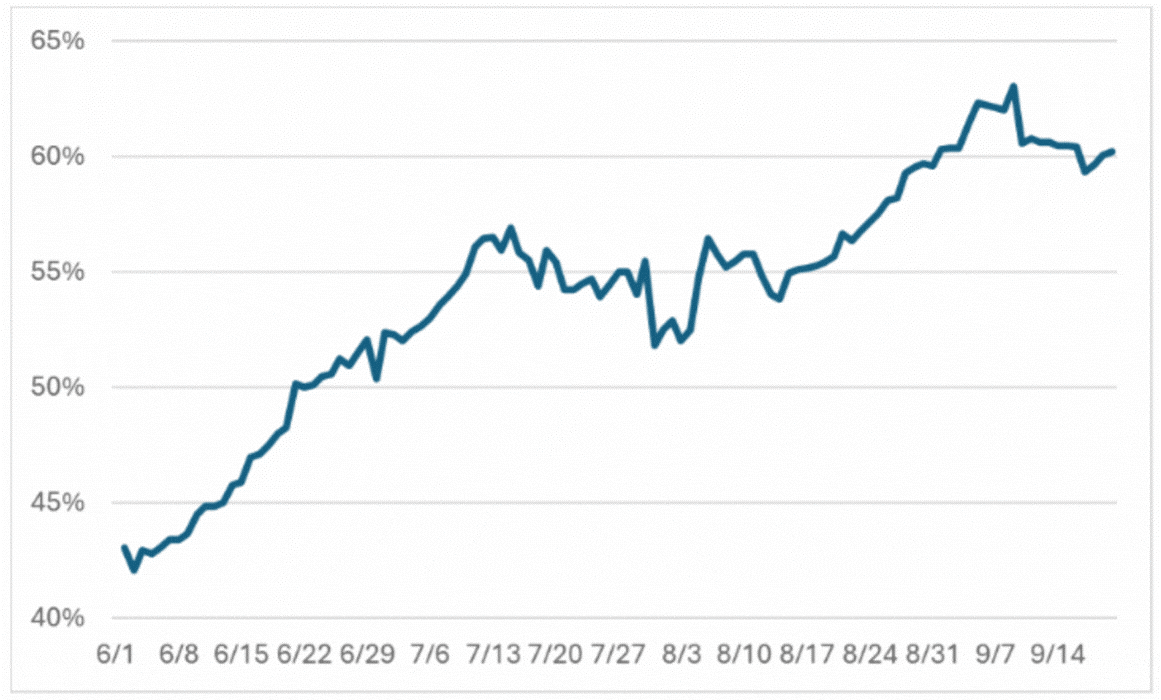
Now that we have pure information versions of the two signals, we can combine them to find the true election probabilities that best explain them. As is often the case, these probabilities do not resemble each individual signal, and depict a lot less volatility. They show Trump beginning June as an underdog and steadily gaining ground to become a favorite, when Biden dropped out of the race.
There’s no statistical evidence of Kamalamania: the candidate’s prospects stayed roughly the same through the Democratic convention, after which Trump resumed his rise. If we account for all biases and take stock of only the pure data on election probabilities, he now appears to be about a 60% favorite, though both PredictIt and Silver still have him as a slight underdog in their actual forecasts.
Combined Silver and PredictIt Trump Forecast – Adjusted for Biases

Source: Analysis of data from PredictIt and Nate Silver’s Substack.
Parting Thoughts
You may or may not agree with my deconstruction of PredictIt and Nate Silver. My point is that this is how risk managers have to think about signals.
First, you must adjust each signal for biases, then look for plausible realities that are consistent with all signals. In most cases, signals are only negative information — they can rule out implausible realities, but they don’t tell us much about the most plausible ones.
When evaluating forecasts, to get to the closest version of the truth, risk managers must not only weed out biases but also extract the most useful data from various signals.
Aaron Brown worked on Wall Street since the early 1980s as a trader, portfolio manager, head of mortgage securities and risk manager for several global financial institutions. Most recently he served for 10 years as chief risk officer of the large hedge fund AQR Capital Management. He was named the 2011 GARP Risk Manager of the Year. His books on risk management include The Poker Face of Wall Street, Red-Blooded Risk, Financial Risk Management for Dummies and A World of Chance (with Reuven and Gabriel Brenner). He currently teaches finance and mathematics as an adjunct and writes columns for Bloomberg.
Topics: Metrics