
Tests conducted by researchers at the Durham University Business School, in collaboration with the Risk Accounting Standards Board (RASB) found that exposures to the operational risks of U.S. banks may have increased by as much as 60% during the eight years leading up to the financial crisis of 2007-'08.
Academics are putting the risk accounting method through its paces. Initial tests of the method involved restating publicly available quarterly submissions of U.S. bank financial data (the FR Y-9C dataset) into RUs (risk units), the new additive risk metric designed to express all forms of operational risk.
The Objective
A guiding principle of Risk Accounting is that material exposure to operational risk is created upon the acceptance of sales or trades, as this is what activates banks' supply chains and operating infrastructures. The test, covering the eight years immediately preceding the global financial crisis, was focused on a calculation of exposure to inherent operational risks, which is the amount of accepted risk before considering the risk-mitigating effects of internal risk management activities and processes.
A principal aim of the test was to determine whether the RU possesses predictive properties, which would potentially be the case if it can be demonstrated that an accelerated increase in trended operational risk RUs was followed by material unexpected losses.
The test was applied to a sample of 15 of the largest U.S. banks:
| Bank of America | Huntington Bancshares | PNC Financial Services |
| BB&T Corporation | JPMorgan Chase | Regions Financial |
| Capital One | Keycorp | State Street |
| Citigroup | M&T Bank | Suntrust |
| Fifth Third Bancorp | Northern Trust | Wells Fargo |
Banks that underwent significant reorganizations (mergers, acquisitions etc.) during the test period were not included in the sample to ensure the comparability of trended RU outputs along the time series.
The Results
The following chart plots two progressions relative to the above banks: (1) exposure to inherent operational risks, in RUs (IR); and (2) net income before taxes (NIBT). The active chart is available here with drilldown by bank, product, and year/quarter.
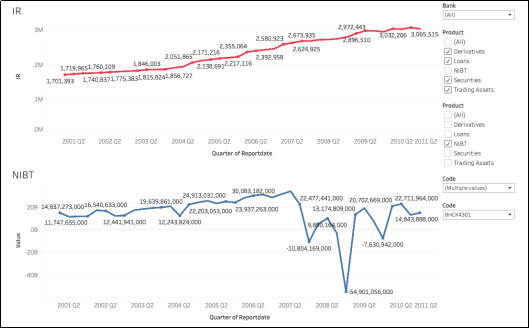
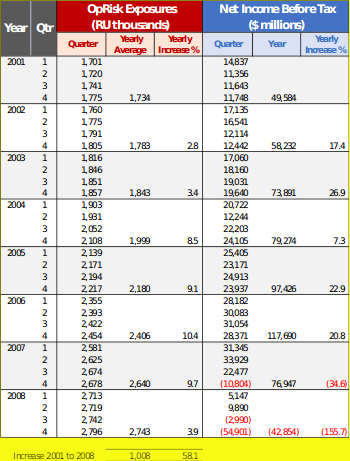
Below is a tabulation of the above chart that shows the year-on-year and quarter-by-quarter progressions, and the increase in operational risk exposures for the period 2001 to 2008.
The Method of Calculation
Inherent operational risk is calculated by combining two risk factors in an algorithm.
The first, Exposure Uncertainty Factors (EUFs), relate to the relative operating complexity and consequent process burden each product imposes on the organisation. EUF tables encompass six categories of internal risk-mitigating activities and processes: transaction processing, lending, trading, treasury (funding and interest rate management), selling, and environmental impact.
The second is the Value Band Weighting (VBW) that relates to the volumes and values of daily new business transacted or traded in a product.
Proxies and Caveats
A primary input to the Inherent RU calculation is the VBWs associated with the daily new business transacted in each product. This information was not available to the researchers; consequently quarterly on- and off-balance-sheet outstandings by product, available in the FR Y-9C dataset, were used as a proxy.

For risk assets (securities, loans and lease financing receivables, and trading assets) $ outstandings were used, and for derivatives, notional $ values. Whereas outstanding principal with respect to risk assets and the notional values of outstanding derivative contracts have similar properties, the researchers acknowledge that their non-differentiated treatment in the Inherent RU calculation requires further analysis.
Product definitions and categorizations required for the FR Y-9C submissions were not always sufficiently granular to support direct mapping to EUF tables. In these cases, researchers assigned EUFs to products on the basis of reasoned assumptions.
In other cases, an EUF assignment could not be made where product attributes are subject to the idiosyncrasies of individual organisations. For example, the EUF table that relates to “selling” (conduct risk) enquires as to the existence of product-specific sales incentive schemes. In these cases, an EUF assignment was excluded from the calculation.
Conclusion
The chart reveals a quite dramatic, 58.1% increase in exposure to operational risks over the eight-year period, followed by catastrophic losses. This provides some indication that the RU potentially possesses predictive properties, which begs the question, would boards, C-suite executives and regulatory supervisors have acted differently were such analytics available at the time?
The chart plots the progression of Inherent RUs that represents maximum exposure to operational risks. A more appropriate analysis would focus on Residual RUs that represent actual exposure. However, the latter calculation requires inputs from enhanced risk & control self-assessments (RCSAs), where color-coded “RAG” assessments are replaced with a system of numerically weighted risk factors.
Upgrading RCSAs to “enhanced” status enables the observation of accumulating Residual RUs and operational loss events over time and the modeling of statistical correlations between these two variables. Such modeling will progressively refine the RU's inherent predictiveness and ultimately produce a monetary value for the RU which can potentially be used in capital adequacy determination.
The researchers intend to initiate the next phase of the research in the foreseeable future, involving proofs-of-concept applied to enhanced RCSAs, calculations of operational risk Residual RUs, and AI modelling of the RU.
The Durham University Business School and Risk Accounting Standards Board welcome expressions of interest.
Peter Hughes (peter.j.hughes@durham.ac.uk) is chairman of the Risk Accounting Standards Board. He is also a visiting fellow and advisory board member of the Durham University Business School's Centre for Banking, Institutions and Development (CBID), where he leads research into risk-based accounting. He was formerly a banker with JPMorgan Chase. He previously authored Where Next with Operational Risk?