
In Part I, I explored the concept of Enterprise Risk Management Maturity Models, and how they can be effectively used to identify an organization's current ERM capabilities across multiple dimensions, benchmarked against industry standards. This insight is only useful for executives, however, if current and target capability maturity levels are linked to value generation for the organization.

Part II draws the linkage between ERM maturity and value creation. This exploration presents a cautionary tale. As will be seen, not all investment generates value. In fact, while higher levels of ERM capability maturity can yield significant value toward increasing the opportunity for an organization to achieve its strategic objectives, low levels of maturity are likely contributors of negative value. For the many organizations that get stuck in these low levels of ERM maturity, a decision needs to be made: Embrace the actions needed to increase maturity capability, or consider shutting down the program.
As a reminder from Part I, it is important to understand what I mean by “value.” It is defined in this context as the net result of “benefits” minus “costs.” A synonym for value in this circumstance would be “net benefit.”
Costs and benefits are clearly both monetary and non-monetary, the latter being much more difficult to quantify. Opportunity costs may be as prevalent, if not more than, out-of-pocket costs when it comes to ERM. Benefits may accrue in terms of achieving better outcomes or by avoiding worse outcomes, once again the latter being difficult to measure. Despite these variables, I believe notional constructs can be employed to provide a directional sense of the costs, benefits, and ultimately value generated as ERM capabilities progress through the stages of a maturity model.
Figure 1: Value Curve for ERM Maturity (RIMS)
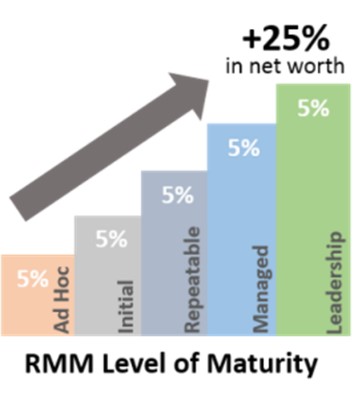
Various attempts have been made to depict the relationship between ERM maturity levels and value generation. RIMS identified a linear progression of value as an enterprise moves from one level of maturity to the next, estimating a 5% increase in net worth associated with each step in the process (see Figure 1).
Figure 2: Value Curve for ERM Maturity (Marks)
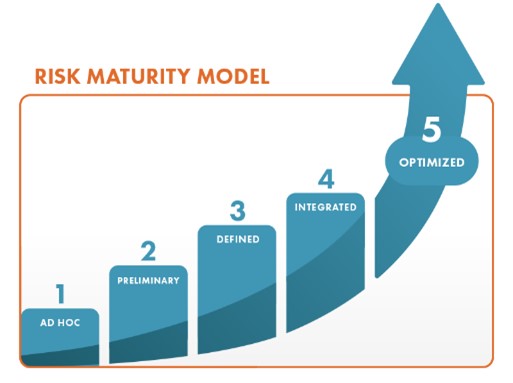 Others have advanced the concept of value generation that starts slower in the early levels of the model but rises at an accelerated rate as organizations achieve higher levels of maturity. One such example was offered by risk management author Norman Marks (Figure 2). Looking at the shape at the bottom of the curve, one can see an increase in the slope as capability maturity moves from the earliest levels to the latter ones.
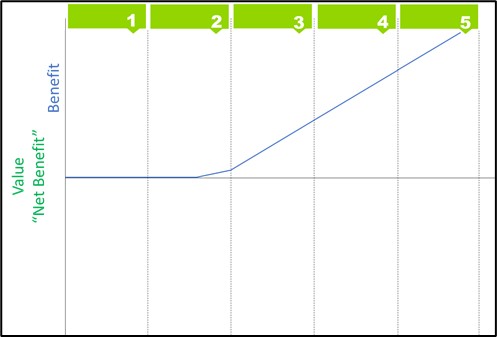
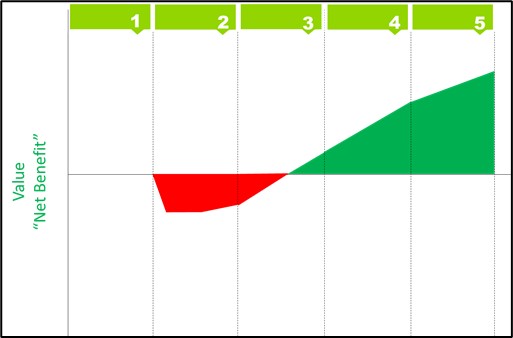
As I tried to apply these different approaches to client settings, I continued to question whether these curves were consistent with the actual value generation recorded by organizations as they matured through their ERM journey. In a recent project, I made an attempt to more precisely draw this value curve, with a particular fixation on the differences between the first two levels and the next two levels. This is what I came up with (see Figure 3), which, by the way, I believe is still not quite right, as will be explored in a moment.

This odd-looking figure is a modification of Marks's curved model. The main intent was to depict that there is very little generated by ERM programs in Level 1 of ERM Maturity, and not much more in Level 2. Both delivered value, but relatively small.
Then, in Level 3, when ERM capabilities, practices, and cultural components really begin to take hold is when significant value begins to accrue, extending at a similarly aggressive rate in Level 4. And while significant additional benefits are realized in Level 5, I chose to slightly decrease the rate of the value curve to reflect the notion that to attain these sophisticated capabilities, there likely will be increased capital investments necessary, perhaps in technology platforms, that would slightly erode the overall value (or “net benefit”) that is generated when compared to the rate of increase in the previous two levels.
The point I was trying to emphasize in this model is that value generation is limited in the first two levels, but then accelerates rapidly as capability maturity expands into the final three levels. Directionally, I believe this view remains correct. However, I have since concluded that I did not take the concept far enough. This revelation brings me to the development of the model I'm introducing today.
Costs and Benefits Determine ERM Value Generation: Breaking Even Isn't Guaranteed
Before breaking down views on costs and benefits, we can start by acknowledging that since formal ERM capabilities have not yet been introduced in Level 1, there are essentially zero costs, zero benefits and, therefore, zero value generated by ERM at this stage of maturity. Level 1 is our baseline, representing whatever risk management capabilities were already in existence in the organization prior to the introduction of formal ERM. Therefore, the concepts of costs, benefits and value realization kick in at the onset of Level 2 when ERM investment begins.
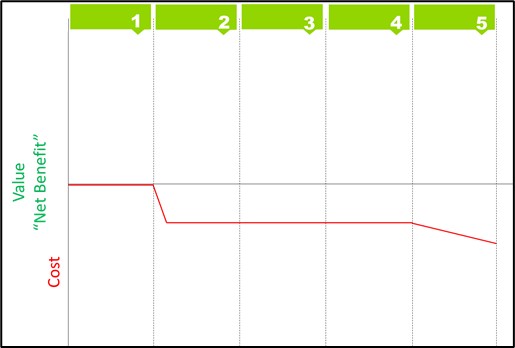
Let's first take a look at the cost scenario as depicted in Figure 4. One of the things that we have learned from the annual Federal ERM survey conducted by Guidehouse, in partnership with the Association for Federal Enterprise Risk Management (AFERM), is that the level of investment in ERM tends to stay rather constant throughout the life of the program, recognizing that the kind of costs may shift during the lifecycle of the program. For example, in the early phases of maturity, costs may be heavier for external consultants to assist in designing and implementing the initial frameworks, capabilities, tools and training necessary to lay the foundation for future maturation. As the workforce becomes more engaged in risk management activities, opportunity costs may rise as consultant fees diminish.
Nevertheless, according to the year-over-year responses to this survey, the overall amount appears to be relatively static through the fourth stage of maturity. As stated previously, those costs will likely need to increase as the organization ventures into Level 5 maturity, as additional capital outlays may be needed to achieve the capabilities associated with this maturity level.
The model put forward in this article diverges from others in the market primarily on the benefit side of the equation, as shown in Figure 5. Having stood up an ERM program as the first chief risk officer at the Internal Revenue Service (IRS), and in supporting more than a dozen ERM implementations as the ERM Solutions leader with Guidehouse, it is my conclusion that not only are zero benefits realized in Level 1, zero benefits continue to be realized well into Level 2 maturity before they start to emerge as the organization begins to complete Level 2 and evolve toward Level 3.
Benefits are derived via improved outcomes, based on decisions that would not have been made without the ERM capability in place that help to enhance results or to avoid organizational stumbles. Mere activities, represented at times by the exhaustive work undertaken to establish the underlying components of the program during Level 2, primarily comprise programmatic inputs and outputs. These include the critical foundational elements of frameworks, charters, standard processes and tools upon which the value profile of ERM can ultimately emerge.
Nevertheless, in and of themselves, these activities rarely lead to meaningful outcomes to the organization at this phase of development. It is really only when these baseline elements begin to solidify and attract organizational engagement, toward the latter half of Level 2, that benefits begin to accrue. There are numerous accomplishments that occur in Level 2 based on a lot of hard work, but actual impacts on organizational outcomes have typically not yet been realized.
It is in the subsequent maturity levels that the benefits rise in considerable fashion. This is where cultural adoption begins to spread throughout the organization as leaders encourage risk transparency and the workforce not only understands the methods and expectations, but also begins to consistently perform as desired. The value proposition truly kicks in as the capability maturity enables the linkage between strategy, performance, and risk, and senior leaders begin to routinely make risk-informed decisions that put the organization in the best position to achieve its most important goals. These are characteristics of Level 3 and beyond, with only glimpses beginning to emerge in the latter portion of Level 2.
When the costs and benefits are combined, as in Figure 6, one can see that the net value generated in alignment with each maturity level is as follows:
Level 1: Value generation is nil.
Level 2: Value generation is negative.
Level 3: Value generation remains negative through the first portion of the level, before turning positive in the second half of the level.
Level 4: Value generation is positive and grows considerably.
Level 5: Value generation is positive, continues to grow, although at a slightly reduced rate than the previous two levels.
The Level 2-3 Challenge
If one accepts this depiction of ERM maturity-based value generation, then the takeaway is profound. If an organization is not willing to persist in its ERM journey beyond the foundational activities associated with Level 2 maturity, as well as the first half of Level 3, then starting the program is a mistake. This is a material observation given how many ERM programs find themselves essentially stuck in these loer levels of maturity.
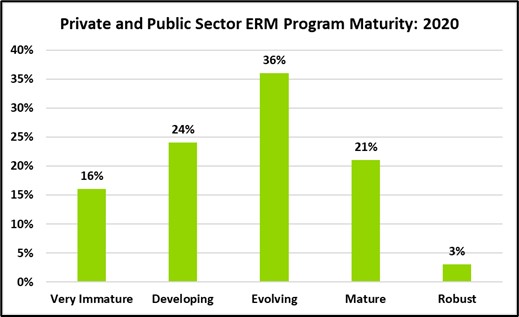
As can be seen in the latest survey data from North Carolina State University's ERM Initiative (see Figure 7), 40% of ERM programs characterize themselves as residing in maturity Levels 1 or 2, which, as described earlier, is at a point where either zero value or negative value have typically been created. That number increases to 76% if the third level is included, where still only limited value is being realized and only for those that have already begun to fully embrace the characteristics associated with this third level.
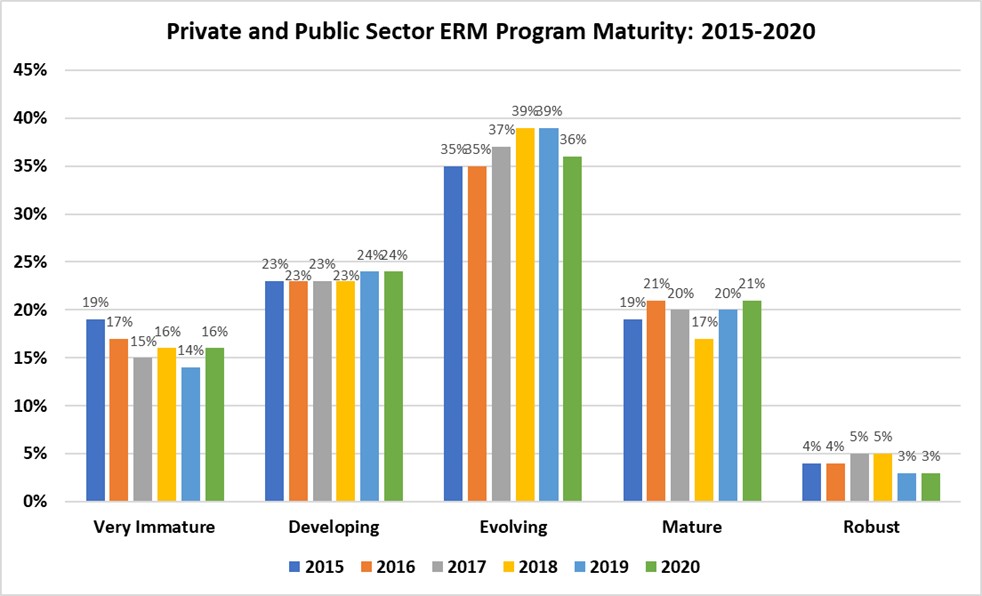
Significantly, these survey results are not representative of just a single point in time. In fact, these results have remained virtually unchanged for each of the past six years (see Figure 8). Therefore, it is reasonable to assume that many organizations are, indeed, “stuck” in some of these early levels of maturity, at a point where value generation is primarily negative. This was the precise scenario confronting the senior executive and his organization mentioned in Part I of this article. The risk team and other stakeholders were working hard to establish the foundation, but they were stuck trying to get the buy-in and engagement from the rest of the enterprise to begin to embrace the characteristics of a Level 3 organization. They were stuck with inputs and outputs leading to an accumulation of costs without much in the way of organizational benefits to show for their efforts.
Getting Stuck at Lower Levels of ERM Maturity
Emerging from Level 2 is often the most challenging phase of implementing ERM, figuring out how to cross that chasm from establishing the building blocks to transitioning to improved results. There are many reasons that conspire to limit the progression of organizations from moving to higher levels of ERM maturity - providing excellent fodder for another paper but far too numerous to describe for our purposes here. Suffice it to say, however, that some of the most common causes of failure at the Level 2-3 Challenge sit on the shoulders of senior leaders.
Even the most empowered and highly skilled risk teams can take their organizations' ERM maturity only so far without a corresponding widespread adoption of the defined capabilities at all tiers of the organization. Well-defined, color-coded risk identification and assessment templates are only as useful as the information the workforce is willing to report, which is often constrained by cultural factors that tend to suppress risk transparency in these early stages of maturity. Chartered governance forums will not add value if they restrict the scope of their discussions to narrow parts of the business and limited risk types while keeping strategic and emerging risks off the agenda.
Employing business unit risk officers as part of the ERM ecosystem will be unproductive if these resources are insufficiently skilled, trained, and coached to the required level of proficiency and not provided adequate time to fulfill their ERM-related responsibilities. Well-crafted risk appetite statements are useless if they aren't effectively communicated and embraced as enterprise guidance.
These are the organizations that get stuck in Level 2, or early Level 3, leading to massive frustration and broad-based bewilderment on why ERM, despite significant investment of resources, isn't improving organizational outcomes; i.e., generating value.
It is also important to recognize that it is not possible to simply jump from Level 1 to Levels 3, 4, or 5 of ERM maturity. Level 2 is there for a reason. Those foundational activities are the essential building blocks for everything that follows. But Level 2 cannot be an end state, because the inputs and outputs that dominate this level of maturity rarely lead to improved organizational outcomes. That only comes with the commitment to work through Level 2 and begin fulfilling the value proposition ERM has to offer for those willing and able to persevere to adopt the characteristics associated with these subsequent levels of maturity.
On the Path to Meaningful Value Generation
This depiction of the Level 2-3 Challenge and the negative result that occurs when organizations fail to overcome it is not intended as rationale for cutting ERM programs, or not starting them in the first place. In fact, it's just the opposite. It's a call to action. The purpose is to demonstrate the very real value that ERM can generate for organizations, but only when sufficient commitment is made to continue to mature organizational ERM capabilities beyond the simple basics. Those basics may feel like an accomplishment to some, and in many respects they are, but only as a means to a much greater end. If risk insight, risk appetite, and risk indicators aren't being used to enhance analysis in support of decisions to improve the likelihood of achieving strategic objectives, as one would see in an organization on the back half of Level 3 ERM maturity and beyond, then you're likely still sitting on negative value.
Leaders have a choice with respect to ERM. They can:
a) Leave the risk team to its own devices to lead the adoption of ERM throughout the organization without sufficient leadership engagement, and likely get stuck in Level 2 or early Level 3 resulting in negative value generation;
b) Stand down their ERM program, or don't start in the first place, resulting in no value generation (which exceeds the value generated by choice (a); or
c) Commit to the tried and true techniques that have helped organizations break through the Level 2-3 Challenge and reap the rewards that come from being a risk-informed enterprise.
The choice is yours. If you find choice (c) to be attractive, the following steps might help if you find your organization stuck in the lower levels of maturity.
- Perform an assessment of your ERM program against a maturity model as described in this article;
- Have your ERM governance/leadership evaluate the results of that assessment, and determine the target levels of maturity most appropriate for your organization in each of the 10 dimensions over a specific time horizon (many may not reach Level 5);
- Build a clear roadmap on how to achieve those target maturity levels;
- Ensure the roadmap is adequately resourced and staffed, with accountable leaders assigned to the primary actions;
- Establish measurable performance objectives for those accountable leaders (and perhaps contributing leaders as well) for achieving those target maturity levels;
- Establish and maintain leadership engagement in fostering the kind of processes and behaviors, in alignment with organizational strategy, that will maximize value generation from ERM; and
- Over time, assess the impact that ERM maturity has on enterprise outcomes associated with strategic objectives.
One additional note to step (5) listed above. According to the Guidehouse/AFERM ERM Survey, the organizational characteristic most closely correlated with improved ERM maturity and performance is whether ERM-related objectives are placed into the performance plans of all senior executives. What gets measured, gets done.
David Fisher (dfisher@guidehouse.com) is a partner at Guidehouse and founder of the firm's ERM practice. As the former chief risk officer at the Internal Revenue Service (IRS), he implemented the organization's first ERM program. Fisher spent nearly 10 years as a senior executive in the federal government, leading transformation efforts at the U.S. Department of Defense (DoD) and Government Accountability Office (GAO) as well as the IRS. He is the author of Optimize Now (or else!): How to Leverage Processes and Information to Achieve Enterprise Optimization (and Avoid Enterprise Extinction).