
European banks, amid the current environment of rising interest rates, inflation volatility and geopolitical risk, now face the tall task of calculating expected credit losses (ECL) in compliance with the IFRS 9 financial reporting standard. This challenge has been made even more difficult by a controversial probability of default (PD) backstop measure that has been added to IFRS 9 by the European Central Bank (ECB).
The fairness of this backstop is now being called into question, and an argument can be made that it may ultimately be a detriment to risk management, rather than a benefit.
In its supervisory priorities for 2023 to 2025, the ECB urges European banks to operate with “extreme prudence,” and the PD backstop aligns with this guidance. The ECB reasons that the backstop, which calls for banks to shift a loan from Stage 1 of IFRS 9 credit-loss provisioning to Stage 2 if it’s PD increases by 200% compared to origination, will properly transition more loans with an increased default probability to lifetime loan provisioning. This should improve risk management, the regulator argues, by moving high-danger loans into the proper loss-provisioning bucket.
Marco Folpmers
However, some European banks say that this approach could unfairly move certain loans into the lifetime bucket and potentially shift focus to a group of loans that do not need to be transitioned, ultimately weakening risk management.
Before we dive into who’s right and who’s wrong, we first need to explain the difference between Stage 1 and Stage 2 loans. Stage 1 of IFRS 9 requires the estimate of ECL expected credit loss (ECL) for a loan over a 12-month period. Stage 2 requires a bank to calculate ECL over the entire remaining lifetime of a loan, which is obviously a steep increase in loss provisioning. A loan must transition from Stage 1 to Stage 2 when it shows a “significant increase in credit risk” (SICR) from the time of its initial recognition to the time of reporting.
The question now is whether the ECB’s PD backstop is really a fair and necessary addition to the SICR. European banks need to spend considerably more time analyzing whether more loans need to be transitioned to Stage 2 – but this is a “fuzzy math problem,” since it depends on the order in which a bank applies the migration rules for SICR.
Backstop measures are sometimes compared to having an extra lock on the door. Proponents argue that they add to safety and are not detrimental. The ECB contends that there are currently an insufficient number of high-danger loans being transitioned to Stage 2, and that the PD backstop will resolve this problem by ensuring that these loans are properly allocated to the lifetime loan provisioning bucket.
Let’s now examine an example portfolio of loans to determine whether the PD backstop provides more safety or whether it is an unfair and unnecessary tactic that could eventually prove detrimental to risk management at European banks.
False Acceptance Rate and False Reject Rate
In Figure 1 (below) we show, for an example portfolio, risk scores for a group of Stage 1 loans – some of which ultimately defaulted and some of which have not. The risk score, which is a function of the drivers for all SICR criteria, summarizes the default risk of the loan. The staging (deciding whether a loan needs to be transitioned from Stage 1 to Stage 2) was performed based on a threshold of this score.
Loans that have not defaulted received a default score of 0 on the Y-axis, while loans that have defaulted received a Y score of 1. Backtests were performed to determine whether loans that were transitioned to Stage 2 were properly assessed.
Figure 1: Risk Scores for Stage Transitioning (X-axis) Backtested Against Future Default
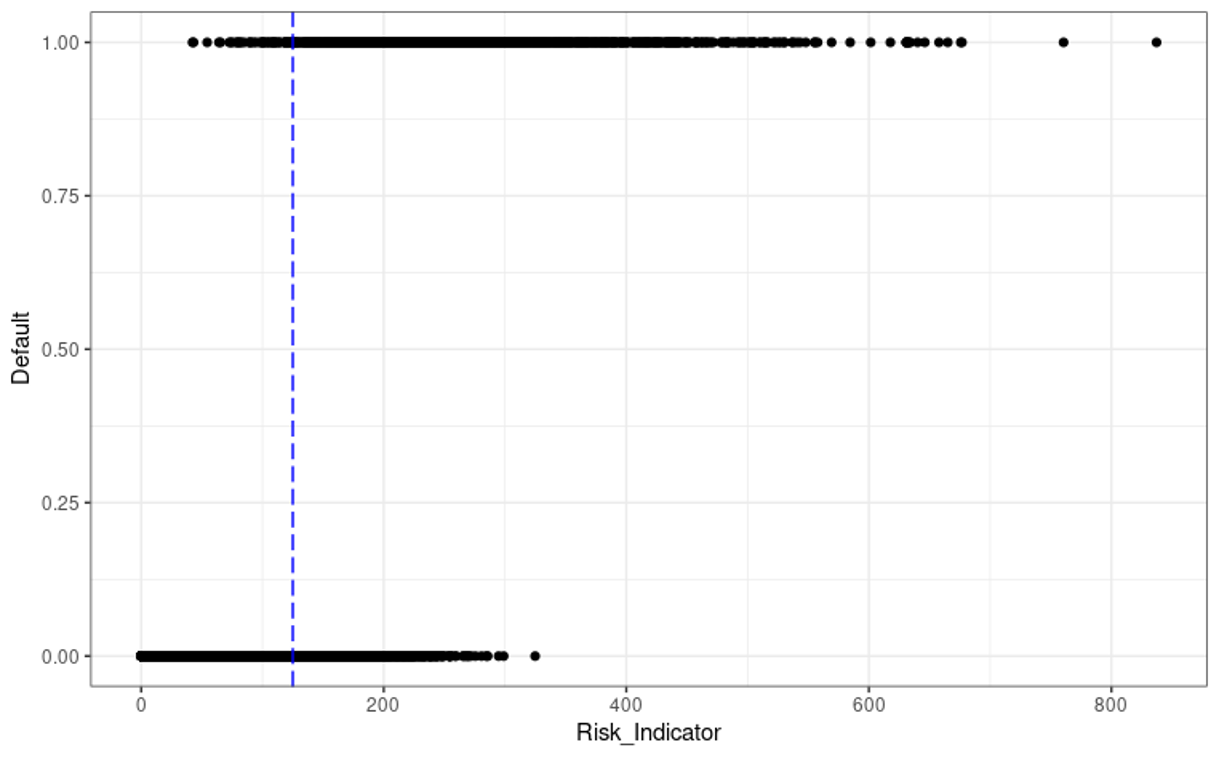
In our example, the threshold for the stage transition (the dotted blue line) is at 125. Loans with a score of less than 125 remained in Stage 1; loans that met or exceeded this threshold were transferred to Stage 2.
The backtest shows that the risk scoring is imperfect. Some loans that were above the threshold, and therefore allocated to Stage 2, turned out to be completely healthy (Default = 0, X > 125). Conversely, there were some loans with risk scores below the threshold that ultimately defaulted.
Technically speaking, the discriminatory power of risk scoring under IFRS 9 (i.e., the ability to discriminate between defaulting and non-defaulting obligors) is flawed. There are many ways of expressing discriminatory power, but one way to do it is with the help of a pair of percentages: the false acceptance rate (FAR) and the false rejection rate (FRR).
FAR can be defined as the number of loans that have been falsely accepted as good – or loans that remained in Stage 1 after the 12-month origination period, but ultimately defaulted. The FRR, in contrast, is the number of loans that have been falsely transitioned to stage 2, because they never defaulted.
In our example, the FAR equals 3.3% and the FRR 16.3%. If we decrease the cutoff value for stage transition, we’d see more loans switch to Stage 2, decreasing the FAR while increasing the FRR. If we were to increase the cutoff value, the reverse would happen – i.e., we’d experience higher FAR and lower FRR.
Crossover Error Rate
For the same portfolio, as demonstrated in Figure 2, we can depict the FAR and FRR for possible values of the cut-off rate. The situation we just described (FAR = 3.3% and FRR = 16.3%, with a cut-off value equal to 125) is depicted by the blue vertical line.
Figure 2: FAR and FRR vs. the Cutoff Rate
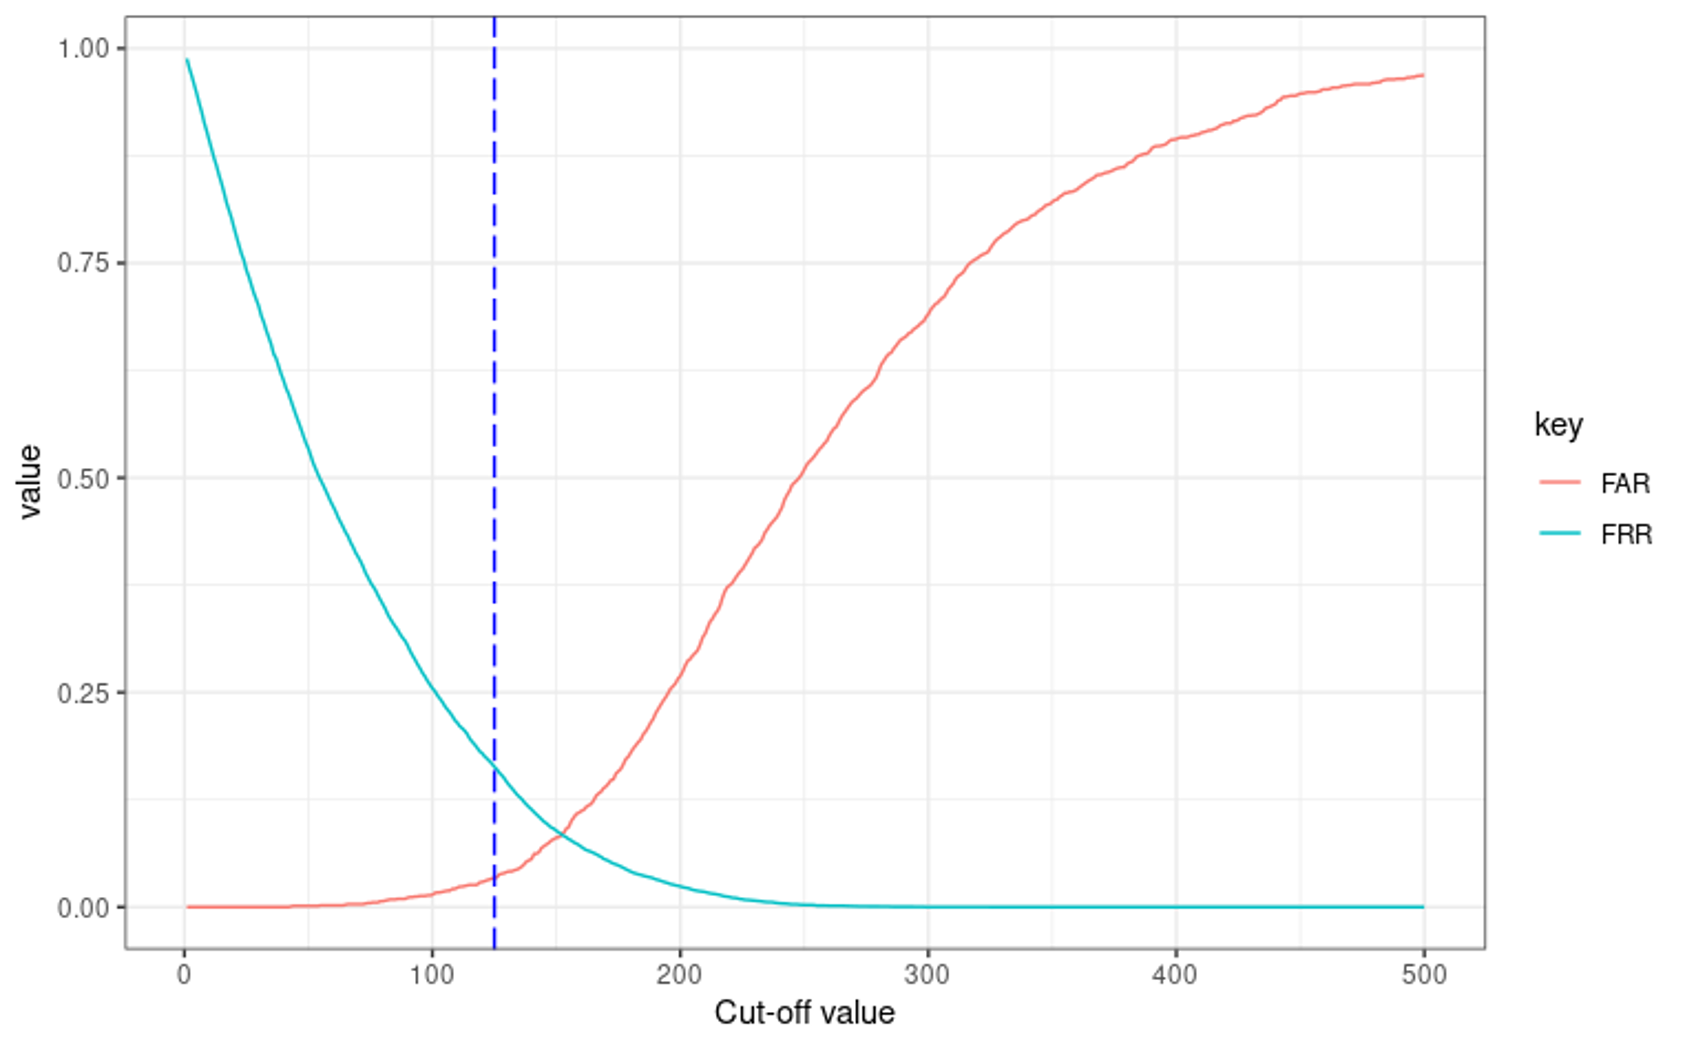
Figure 2 clearly shows that the SICR criteria for stage transitioning is less than ideal. A better (lower) FAR implies a worse (higher) FRR – and vice versa.
It’s also interesting to examine the lowest error rate, which is typically at the crossing of both curves. This specific cut-off value is known as crossover error rate (CER), here depicted at the cut-off point slightly above 150. Given the specific discriminatory power of the risk indicator, one cannot safely go below the CER.
One important rule to follow is that if the costs of making a false acceptance error are equal to the costs of making a false reject error, the optimum cutoff point is at the CER.
In our example, we see that the cutoff point is not optimally located, at it is significantly to the left of the CER. In short, this means that too few loans remained in Stage 1. (The only way to move closer toward the CER would be to increase the cutoff value above 125.)
Backstops are Blunt, Unidirectional Tools
Backstop measures typically push loans that are being considered for transition to the left of the CER in an arbitrary fashion. This doesn’t sound like careful calibration at all.
The ECB’s threefold PD increase, for example, allocates additional loans to Stage 2. Therefore, it is equivalent to moving the cutoff point more to the left.
When we look again at Figure 2, we see that the standard SICR criteria are already overly conservative: more loans are transitioned to Stage 2 than necessary, and our FRR is higher than our FAR. If the cutoff point is subsequently pushed further to the left by a PD backstop measure, we move further away from the CER.
This measure also does not enhance discriminatory power and does not perform a proper assessment of FAR versus FRR. Rather, it leads banks away from such calibrations, and therefore does not encourage proper risk management procedures.
Since it does not take any information about the optimization of FAR versus FRR into account, when the PD backstop actually pushes a loan in the right direction (toward the CER), it’s more of a “lucky shot” than a careful calibration. In other words, even at its best, it’s a very blunt tool.
At a practical level, a unilateral push for fewer false accepts in favor of more false rejects will lead to a heightened inflow in Stage 2, even in situations (as illustrated in Figures 1 and 2) where a bank is already to the left of the CER. In short, the PD backstop requires banks to exert more effort for the monitoring of Stage 2 loans, even when this is not necessary.
When banks spend time analyzing stage transition for loans that do not require a shift to Stage 2, it’s a waste of risk management resources that could have been better allocated elsewhere. For loan-loss provisioning, the PD backstop will also result in a steep and unnecessary increase in ECL.
Parting Thoughts
Supervisors sometimes seem to think that backstop measures are easy instruments to adopt. They see them as serving as extra security and, they reason, who could be against that?
However, as we’ve demonstrated, the ECB’s PD backstop is not conducive toward proper monitoring of false accepts and rejects for IFRS 9 stage transitioning, and can actually lead banks away from the optimum positioning of the cutoff rate. It is a unidirectional, blunt tool – even when it works in the right direction.
What’s more, it does not improve discriminatory power, and, given its propensity to increase the FRR, it turns scarce risk management resources toward loans that do not need to be transitioned.
Unfortunately, it takes more courage for a supervisor to remove a backstop measure than to add one.
Dr. Marco Folpmers (FRM) is a partner for Financial Risk Management at Deloitte the Netherlands.
Topics: Default