
Banks are going to be required to use the so-called foundation approach (F-IRB) to credit risk measurement, for some key asset classes, under the Basel III accord. But is removing the option for banks to use the advanced internal ratings-based approach (A-IRB) – for exposures to large and mid-sized corporates, banks' portfolios, and equities – truly the best strategy?
It is important to keep in mind that, through A-IRB, banks can estimate probability of default (PD), loss-given default (LGD) and exposure at default (EAD); the F-IRB, on the other hand, strictly measures PD, while assigning fixed regulatory values for LGD. What’s more, recent risk parameter data published by the European Banking Authority (EBA) indicates that A-IRB may be superior to F-IRB for credit risk assessment.
Marco Folpmers
The EBA’s risk dashboard summarizes the main risks and vulnerabilities of the banking sector. On a quarterly basis, it releases risk parameters data from EU countries, enriched by data from selected countries outside of the EU. Interestingly, the report and its underlying data focus not only on risk outcomes (say, capital ratios) but also on the underlying dynamics for the risk parameters.
When zooming in on LGD data for banks in the Q4 2022 EBA risk parameters report, two interesting trends emerge: the credit risk portfolios within retail and corporate lending have very specific LGD values – but, there is also ample room for dispersion within the portfolios.
These two parallel trends have important implications for F-IRB and A-IRB for credit risk modeling. They raise serious doubts, for example, about whether it makes sense to extend the limitations on the use of internally-developed estimates for LGD (e.g., the A-IRB approach) to other asset classes, such as corporate lending and retail mortgages.
The EBA Risk Dashboard: Insights on EU Portfolio Data
The EBA’s risk parameters report for banks (Q4, 2022) shows the weighted average values of PD and LGD, per country, per portfolio. The data cover the 27 EU countries, as well as a handful of countries outside the EU: the UK, U.S., Australia, Canada, China, Hong Kong, India, the Republic of Korea, the Russian Federation, Singapore and Switzerland.
The portfolios in the report comprise three retail sectors (retail mortgages, revolving retail and other retail) and two corporate sectors (SME and specialized lending). The reported risk parameters (per country, per portfolio) are the weighted averages of the parameters, per local bank.
After filtering out the non-EU countries, the weighted average PDs and LGDs can be plotted (per portfolio), as in Figure 1.
Figure 1: PDs vs. LGDs, Per Portfolio 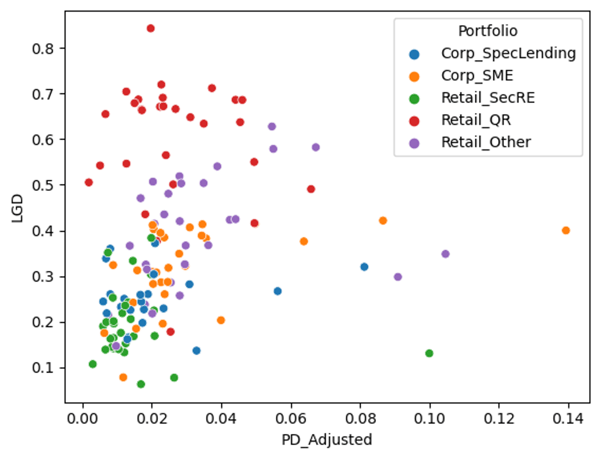
Upon closer inspection of Figure 1, an interesting pattern emerges. Whereas the PD data are broadly scattered (with the exception of Retail_SecRe, or retail mortgages), the portfolios seem to be “stacked” on the LGD (vertical) axis. The lowest LGD portfolio is retail mortgages (the green dots in the scatterplot), while the highest LGD portfolio is retail-revolvers (the red dots). The other portfolios – specialized lending, SMEs and “other retail” – are between these two extremes.
This pattern can be more clearly seen in an LGD-ordered boxplot (see Figure 2).
Figure 2: LGD-Ordered Boxplot
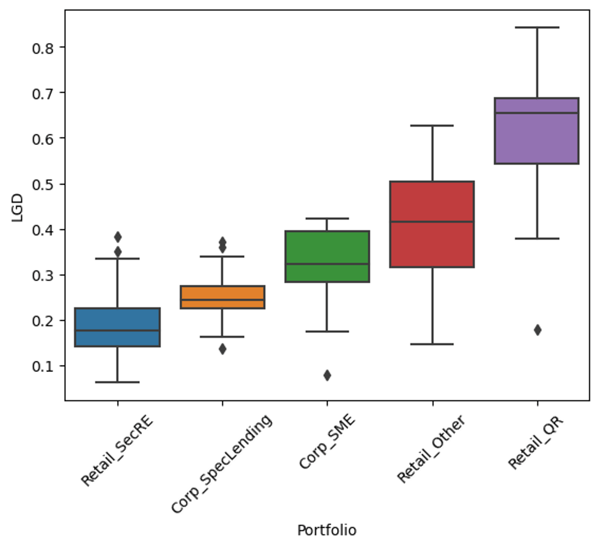
In the ordered boxplot, we see clearly increasing median statistics (the horizontal black line, per portfolio) and almost disjointed interquartile boxes that can easily be stacked upon each other – with the exception of the transition between SMEs and other retail, where boxes overlap. (Remember that the interquartile boxes contain 50% of the data, and run from the first quartile to the third quartile. They can easily be stacked if, in the ordered boxplot, the next portfolio’s box starts at or above the level where the preceding one ends.)
What do we learn from this? First, when looking at average risk parameters (per country, per portfolio), clear patterns emerge. Portfolio trends seem to be homogeneous within the EU countries, and we also discern a clear dispersion pattern where LGDs are much more specific for each portfolio than PDs. So, these portfolios can be more easily characterized in terms of LGD, rather than PD.
Another key finding from the boxplot is that retail mortgages have the best collateral values (lowest LGD), while the other retail portfolio has the least protection; consequently, “other retail” is much more at risk when defaults arise.
Parting Thoughts
After analyzing the EBA’s recent risk dashboard data for LGD at European banks, it’s easy to see an emerging pattern from the product characteristics of the portfolios. The somewhat strict homogeneity across portfolios is striking. It demonstrates that these portfolios are uniformly deployed within the EU, with similar underlying product characteristics – e.g. retail mortgages have lower LGDs than corporate lending and corporate lending has lower LGDs than SME loans.
Since LGDs are generally more difficult to model than PDs, the foundation IRB approach – which only measures PD – seems like a logical option for credit risk modeling. But the EBA’s risk parameter data also shows that LGD dispersion is considerable within portfolios (see Figure 2) – so much so that, collectively, the stacked interquartile boxes comprise almost the entire logical LGD domain, from 0% to 100%.
Given this LGD spread per portfolio, it is, generally speaking, beneficial for banks to internally develop LGD models. However, Basel III has demonstrated some bias against A-IRB (which relies on internally-developed models), even abolishing this approach for large and mid-sized corporates, banks and equities. The EBA’s risk parameter data, though, demonstrate the importance of the A-IRB approach for LGD for asset classes like corporate lending and retail mortgages, and regulators and banks would therefore be wise to avoid expanding the prohibitions on internally developed LGD models.
Dr. Marco Folpmers (FRM) is a partner for Financial Risk Management at Deloitte the Netherlands.
Topics: Modeling