Continuing to decline after a temporary rise last year, the largest banks' weighted average supplementary leverage ratios (SLRs) fell in the third quarter as changes from the Federal Reserve are anticipated.
U.S. regulators adopted a final SLR rule in September 2014, interpreting Basel III guidelines and requiring banks to hold a minimum of 3% Tier 1 capital relative to total assets. The largest banks must hold an additional 2%, for a total of 5%, a minimum that the eight global systemically important banks (G-SIBs) in the U.S. are now trending toward.
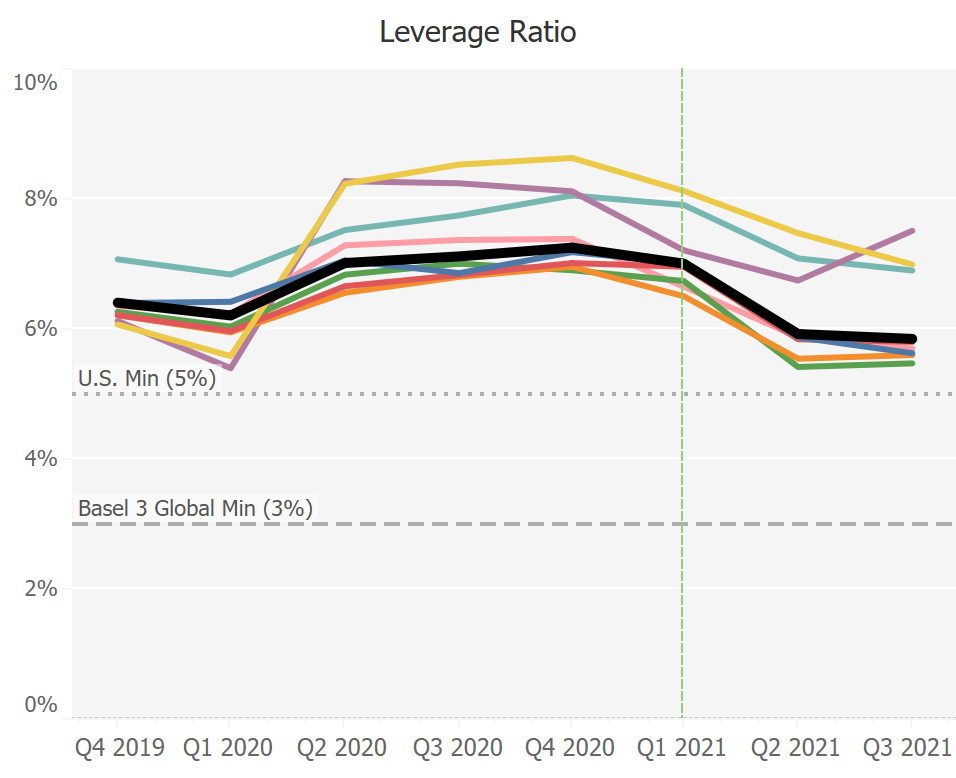
The G-SIBs' weighted average SLR fell to 5.85% at the end of the 2021 third quarter, from 5.92% at mid-year, after dropping from 7.00% at the start of the second quarter, according to the banks' supplemental information reports. The current level is 140 basis points below the 2020 year-end peak that was fueled by COVID-related regulatory relief initiated earlier that year, and 56 basis points below the year-end 2019 figure.
The Fed's COVID relief measure, which allowed banks to exclude certain assets and temporarily increase their SLR ratios, expired last March, and the institutions, erring on the side of caution, have maintained historically high levels of Treasuries and excess reserves.
Figure 1: U.S. G-SIBs' SLRs - COVID-19 Regulatory Relief Impact
The SLR is calculated by dividing a bank's Tier 1 capital by its total leverage ratio exposure. The leverage ratio exposure is the sum total of on- and off-balance-sheet exposures, derivative exposures and securities financing exposures, and does not categorize assets based on risk. The SLR is, therefore, viewed as a backstop to existing risk-weighted capital requirements.
The Measure of Relief
At the onset of the pandemic, banks rapidly increased their reserves and holdings of U.S. Treasury bonds and other safe assets, while Tier 1 capital remained stable. That put downward pressure on SLRs and prompted the Fed's relief measures, which enabled banks to offset that pressure by excluding those assets from the ratio's denominator.
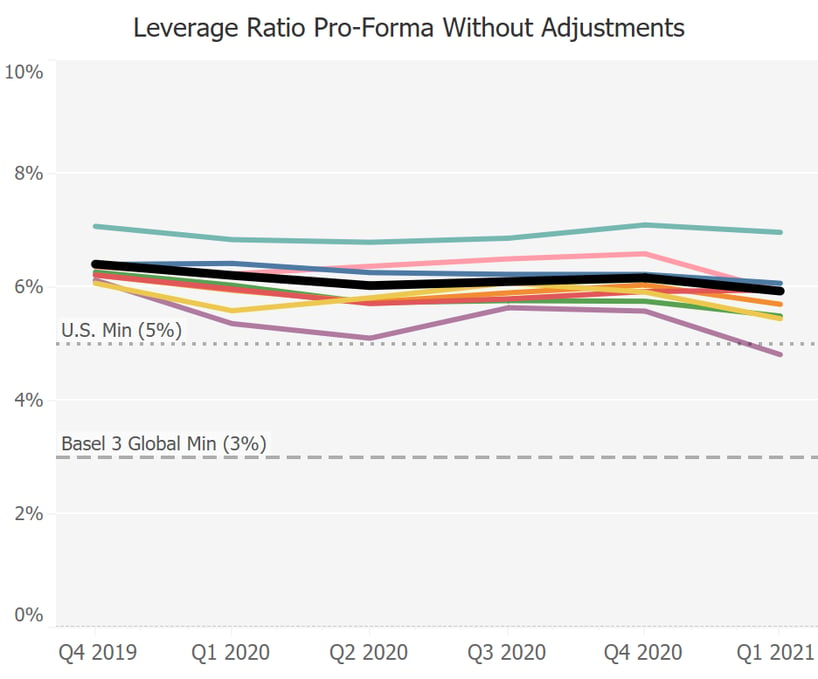
A pro forma view of the SLR, without the Fed's COVID relief measure, illustrates the impact of the regulatory action. The G-SIBs' weighted average pro forma SLR was 5.93% at the end of 2021's first quarter, compared to the 7.01% average reported by the banks. When the exemption expired in March, the pro-forma effectively reverted to the banks' reported numbers.
Figure 2: U.S. G-SIBs' SLRs - Hypothetical Status Quo
Source: GARP's Pillar 3+ platform
SLRs dropping below 6% raise eyebrows because of the 5% minimum that regulators require of G-SIBs in the U.S. Without the Fed's relief measure, some bank SLRs would have fallen precariously close to that minimum, including that of JPMorgan Chase, the nation's largest bank, which saw its SLR plummet 130 basis points in the second quarter, to 5.42%. Bank of America's and Citi's SLRs fell to 5.87% and 5.84%, respectively, each dropping more than 100 basis points.
During the COVID relief period, JPMorgan's average SLR on a pro forma basis was 5.68%, the second lowest among the G-SIBs, down from 6.26% at the end of 2019. In fact, the average pro forma SLR for five of the eight G-SIBs was below 6% during that period.
At the end of the third quarter, 2021, JPMorgan's SLR remained virtually unchanged, at 5.47%, while Bank of America's fell to 5.63% and Citi's was unchanged. Goldman Sachs' third-quarter SLR was essentially unchanged from the previous quarter, at 5.60%, which was 90 basis points lower than at the end of the first quarter.
Custodial Contrast
Only BNY Mellon and State Street - the largest custody banks - saw their third-quarter SLRs increase relative to the average during the COVID relief period. The other G-SIBs' SLRs were, on average, 30 basis points below their pro forma average during that period.
As SLRs have dropped significantly since the end of COVID relief, top executives including JPMorgan CEO Jamie Dimon have called for making the SLR relief permanent.
Still, before the pandemic, the G-SIBs had seen a steady decline in their SLRs over several years on a weighted average basis, and most of the banks' SLRs slid significantly in the first quarter of 2020 (see graphic below), with those of BNY Mellon and State Street falling well below 6%. The weighted average SLR of all the G-SIBs fell to 6.21% at the end of the first quarter, from 6.41% at the end of 2019.
Figure 3: 5-Year History for U.S. G-SIBs' SLRs
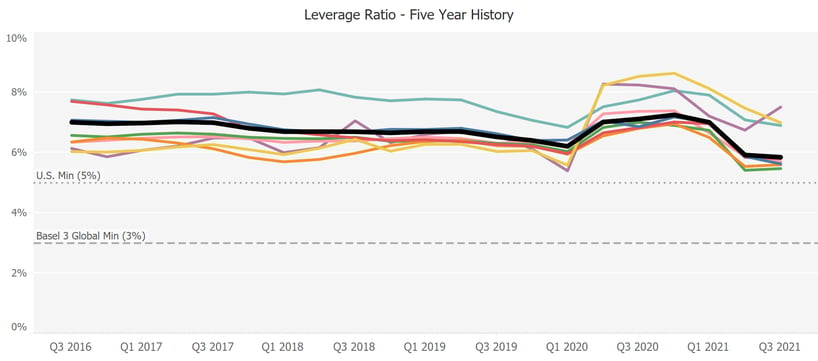

Source: GARP's Pillar 3+ platform
That change was fueled partly by a 2.70% increase in first-quarter aggregate leverage ratio exposure. That compared with the average quarterly increase in aggregate leverage ratio exposure of 0.97% for all of 2019. This growth was driven by on-balance-sheet and derivative exposures. Aggregate on-balance-sheet exposures increased by 3.67%, and aggregate derivative exposures increased by 5.36%.
The Fed's temporary exclusion pushed the G-SIBs' aggregate leverage ratio exposure down by 9.61%, and the banks' weighted average SLR increased to 7.01%. The SLR increase was also aided by a 2.13% increase in Tier 1 capital, which banks issued to shore up their capital base.
The positive impact of the COVID relief on G-SIBs' SLRs began to wane during the second half of 2020 as fundamentals leading up to the pandemic weighed in, including higher leverage ratio exposures. That trend became very apparent after the relief measures ended, and the banks' aggregate leverage ratio exposure increased 20.72% by the end of the third quarter, to $17.03 trillion, from $14.1 trillion.
Concurrently, aggregate Tier 1 capital increased by just 0.76%. The leverage ratio exposure increase, therefore, was the biggest factor pushing down the third quarter's weighted average SLR.
Figure 4: SLR and Component Breakdown for U.S. G-SIBs
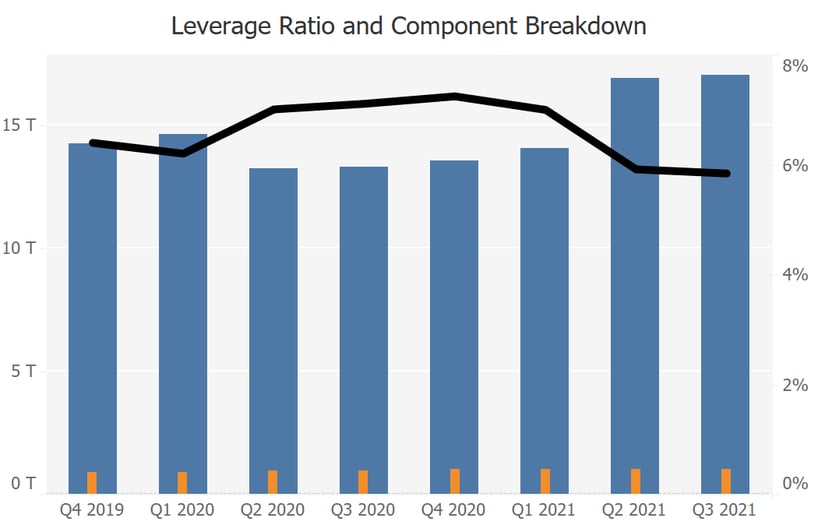
Source: GARP's Pillar 3+ platform
This has led to pleas by the largest banks to extend the SLR exemption or otherwise reform the SLR. Federal Reserve Chair Jerome Powell has signaled that regulators are weighing significant changes to a key capital requirement for large banks, after market dislocations during the pandemic suggested potential flaws in the measure. Powell said during a June press conference, “We will take whatever actions are necessary to ensure that any changes we do make, or recommend, do not erode the overall strength of bank capital requirements.”
*This article is based on data obtained from public regulatory filings and aggregated in the GARP Pillar 3+ platform by GBI - GARP's risk data utility.