

Menu
Credit Edge
Friday, January 29, 2021
By Marco Folpmers

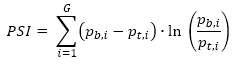
All banks need to meet quality standards for their probability of default (PD) rating systems, and the Population Stability Index (PSI) is an easy-to-use PD stability assessment tool. However, it's not flawless.
PSI does not consider, for instance, the riskiness of different levels of PD buckets. On the other hand, it is a user-friendly diagnostic index.
Before delving further into its benefits and deficiencies, we first need to better understand what exactly what PSI is and how it works.

Banks are required to report to supervisors about the quality of their PD ratings with respect to accuracy, discriminatory power and stability. PSI is a widely-used industry standard for assessing the stability of a PD rating system. Though the use of PSI it not typically mandated, it is favored by many regulators - including the European Central Bank, the Bank for International Settlements and the Federal Reserve Bank of Philadelphia.
For a PD rating system to comply with regulatory guidelines, the distribution of loans across PD buckets should remain “more or less” the same over the course of one year. This is where PSI - which assesses the stability of PD rating migrations - comes in very handy.
When a rating migration of a loan occurs, its PD is in one bucket at “time t” and another at “time t+1.” A PD rating system is considered unstable when there is too much migration - i.e., when the distribution of a bank's portfolio changes significantly across PD buckets after a period of one year.
PSI does not assess PD rating improvements or deteriorations. Rather, it focuses on the stability of the PD rating outcomes. When evaluating the efficacy of PSI, this is important to remember.
Determining PSI
The PSI is calculated as follows:
In the above formula, is the proportion of loans in a rating grade
  for the base population (say, one year ago);
  is the proportion of loans in a rating grade for the target population (say, the same portfolio now); and
  is the total number of rating grades. For a PD rating system, each grade is linked to a PD value that typically starts at (or is slightly above) the Basel minimum of three basis points (3bp) and increases exponentially to above 20% for the last (performing) rating grade.
This calculation is easy and elegant. One can interpret the PSI index as the sum of individual non-negative components. It is not necessary to use absolute values for the first factor  since, if it is negative, the second factor
  is negative as well; hence, we always end up with a sum across non-negative elements. (Remember that
  is negative for
  .)
.)
A rule of thumb is that PSI values below 10% are excellent, while those above 25% are poor. Any PSI in between these two markers is considered to be in a “grey area.”
As illustrated in the example below, PSI can be calculated in a simple table.
Table 1: A PSI Example
|
Rating Grade |
Base |
Target |
Base - Target |
ln(Base) - ln(Target) |
Product |
|---|---|---|---|---|---|
|
1 |
5.08% |
3.07% |
2.02% |
0.51 |
1.02% |
|
2 |
16.11% |
12.35% |
3.77% |
0.27 |
1.00% |
|
3 |
23.23% |
20.82% |
2.40% |
0.11 |
0.26% |
|
4 |
22.88% |
23.27% |
-0.40% |
-0.02 |
0.01% |
|
5 |
17.12% |
19.50% |
-2.38% |
-0.13 |
0.31% |
|
6 |
9.91% |
12.59% |
-2.68% |
-0.24 |
0.64% |
|
7 |
4.27% |
6.08% |
-1.81% |
-0.35 |
0.64% |
|
8 |
1.22% |
1.98% |
-0.75% |
-0.48 |
0.36% |
|
9 |
0.18% |
0.33% |
-0.16% |
-0.64 |
0.10% |
|
10 |
0.01% |
0.01% |
-0.01% |
-0.88 |
0.01% |
|
Total |
100.00% |
100.00% |
|
|
4.35% |
In the above example, the outcome of the PSI outcome is satisfactory, since the index (or total PSI score of 4.35%) is below the threshold of 10%. However, this is not the whole story. When looking at the graph of the base and target distributions for PSI, one notices a very specific pattern:
Figure 1: PSI Calculation with Graphical Inspection
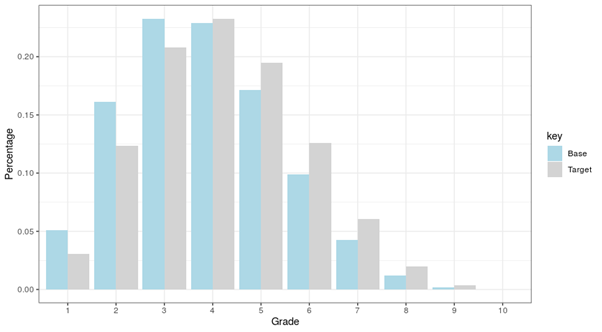
As you can see, the target distribution in the above example has shifted to the right. If the shift toward worse rating grades is significant (as in the above case), it should be picked up by a PD accuracy measure. As previously discussed, though, the PSI should ideally be neutral with regard to the direction of rating movements.
An Imperfect Tool
Even when its supplemented by accuracy and discriminatory power measures, something does not sit right with the PSI. One key issue is that it does not treat each PD bucket of loans equally, regardless of the degree of risk of each individual bucket. Since PD buckets are ranked on an ordinal scale (e.g., a loan in “bucket 3” has more risk than one in “bucket 2”), this is a problem.
Indeed, rating migrations between higher PD buckets have much more impact - with respect to the risk profile of a bank's portfolio and the required capital - than rating migrations between lower PD buckets.
In Figure 2 (below), we show a common, exponentially increasing PD scale (the dotted line), as well as the contribution of each rating grade to the PSI score. The PSI of 4.35% is the total of the amounts indicated by the “vertical needles” (or upright black lines) in the graph.
Figure 2: An Example of PSI Calculation, with a PD Scale
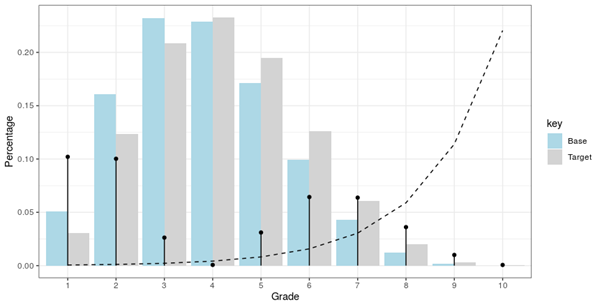
In Figure 2, the net inflows in the risky grades 6 and 7 carry less weight toward the PSI index than the net outflows out of grades 1 and 2. This “rating-bucket neutrality” is a significant drawback of the PSI.
Parting Thoughts
PSI's ease-of-use makes it an elegant and useful tool for assessing the stability of a PD rating system - but it comes at a cost that risk practitioners must consider. Ideally, a comprehensive stability tool for a PD rating system should take into account a bank's entire PD migration matrix.
Dr. Marco Folpmers (FRM) is a partner for Financial Risk Management at Deloitte Netherlands and a professor of financial risk management at Tilburg University/TIAS. He wishes to thank Koen NicolaÏ (FRM), a manager at Deloitte Netherlands, for kindly reviewing an earlier draft of this article.
Advertisement

•Bylaws •Code of Conduct •Privacy Notice •Terms of Use © 2024 Global Association of Risk Professionals
 More
More